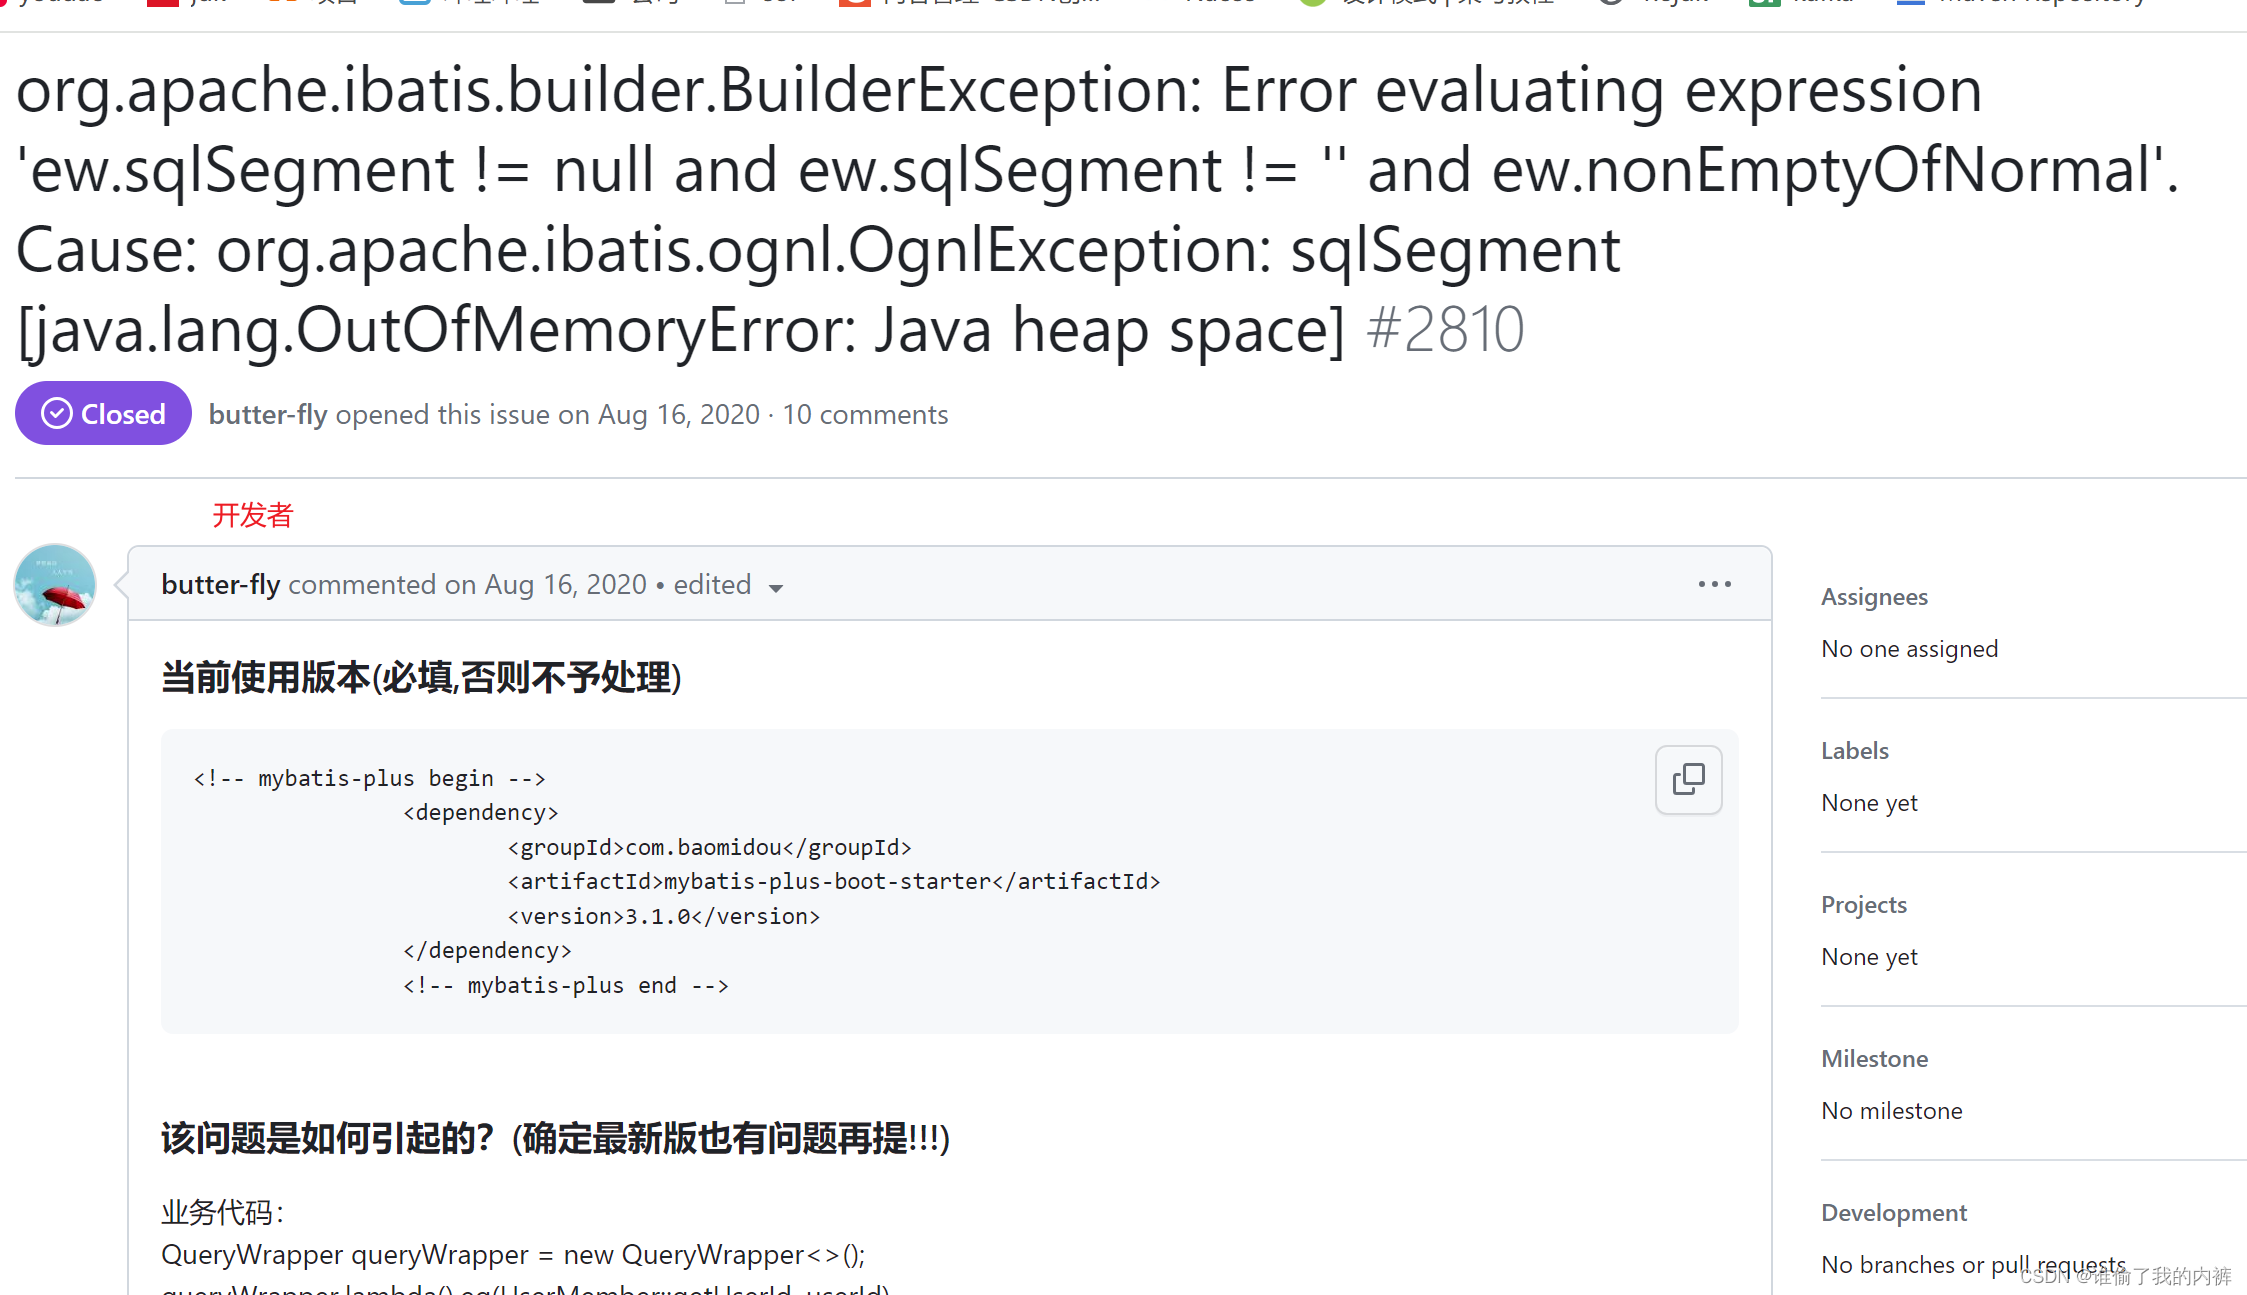
背景:在一个项目调优的过程中,丰富了一些组件后,再次对项目进行压测,发现和之前的性能差距甚大,并且每次运行一段时间后,延迟骤增,带宽骤降,查看程序日志,发现了 OutOfMemory:java heap memory ;
现在知道了结果是OOM了,why?
逐步对比程序新增内容,未发现会导致OOM的地方,都是一些缓存组件和《监控组件》。
那么只能把OOM是的heap dump出来,一探究竟了。
工具准备
大名鼎鼎
MAT
https://eclipse.dev/mat/downloads.php
我的环境里在linux跑的程序且堆内存为16GB,在本地分析内存不够用,所以用了linux版本的;
下载解压即可,需要修改的vm的配置
**cat MemoryAnalyzer.ini **
-vm 指定本地jdk的路径,最新版需要jdk17+
-Xmx 运行的内存,需要大于hedp.dump的大小
第一次指定的10GB,结果跑了一晚上都没跑完。。。
-vm
/data/apps/jdk17/bin/java
-startup
plugins/org.eclipse.equinox.launcher_1.6.600.v20231106-1826.jar
--launcher.library
plugins/org.eclipse.equinox.launcher.gtk.linux.x86_64_1.2.800.v20231003-1442
-vmargs
--add-exports=java.base/jdk.internal.org.objectweb.asm=ALL-UNNAMED
-Xmx30G
完事具备,只欠运行了,
导出堆文件可以选用,其他工具亦可:
jmap -dump:format=b,file=heap.hprof pid
heap.hprof是本地的本目录的堆转储文件
nohup ./ParseHeapDump.sh heap.hprof org.eclipse.mat.api:suspects org.eclipse.mat.api:overview org.eclipse.mat.api:top_components &
大概十多分钟后?
查看运行结果
ll -rth
total 23G
-rw-r--r--  1 root root  17K Jan 23 09:40 epl-2.0.html
drwxr-xr-x 18 root root 4.0K Jan 23 09:40 features
-rwxr-xr-x  1 root root  88K Jan 23 09:40 MemoryAnalyzer
-rw-r--r--  1 root root 9.1K Jan 23 09:40 notice.html
drwxr-xr-x  5 root root 4.0K Jan 23 09:40 p2
-rwxr-xr-x  1 root root  343 Jan 23 09:40 ParseHeapDump.sh
drwxr-xr-x  7 root root  20K Jan 23 09:40 plugins
drwxr-xr-x  3 root root 4.0K Jan 23 09:40 workspace
-rw-------  1 root root  15G Jan 23 09:42 heap.hprof
-rw-r--r--  1 root root  282 Jan 23 09:44 MemoryAnalyzer.ini
drwxr-xr-x  7 root root 4.0K Jan 23 09:44 configuration
-rw-r--r--  1 root root 129K Jan 23 09:45 heap.threads
-rw-r--r--  1 root root 898M Jan 23 09:47 heap.idx.index
-rw-r--r--  1 root root 398M Jan 23 09:47 heap.o2c.index
-rw-r--r--  1 root root 158M Jan 23 09:47 heap.a2s.index
-rw-r--r--  1 root root 1.5G Jan 23 09:49 heap.inbound.index
-rw-r--r--  1 root root 1.6G Jan 23 09:49 heap.outbound.index
-rw-r--r--  1 root root 942M Jan 23 09:49 heap.o2hprof.index
-rw-r--r--  1 root root  19M Jan 23 09:49 heap.index
-rw-r--r--  1 root root 398M Jan 23 09:51 heap.domIn.index
-rw-r--r--  1 root root 676M Jan 23 09:51 heap.o2ret.index
-rw-r--r--  1 root root 1.2G Jan 23 09:52 heap.domOut.index
-rw-r--r--  1 root root 175K Jan 23 09:53 heap_Leak_Suspects.zip
-rw-r--r--  1 root root 129K Jan 23 09:54 heap_System_Overview.zip
-rw-------  1 root root 2.8M Jan 23 10:04 nohup.out
-rw-r--r--  1 root root 449K Jan 23 10:04 heap_Top_Components.zip
-rw-r--r--  1 root root 183K Jan 23 10:04 heap.i2sv2.index
关注三个zip结尾的文件即可
分析
- 下载三个zip到有浏览器的机器上即可,主要关注heap_Leak_Suspects.zip

发现了异常的信息,prometheus端点占了1GB+的内存,排到第二名,不可思议。
再观察heap_System_Overview文件

发现大量指标类的对象

根因
通过以上的分析,大概定位了问题的起因,新的代码中引入了对于netty相关的mertrics暴露,用于分析性能瓶颈,加入了以下配置代码
@Component
public class WebServerConfig  implements WebServerFactoryCustomizer<NettyReactiveWebServerFactory> {

    @Override
    public void customize(NettyReactiveWebServerFactory factory) {
        //暴露reactor.netty相关指标到端点/actuator/prometheus
        factory.addServerCustomizers(httpServer -> httpServer.metrics(true,(k)-> k));
    }
}
分析mertrics方法的源码如下:
Whether to enable metrics to be collected and registered in Micrometer's globalRegistry under the name reactor.netty.Metrics.HTTP_SERVER_PREFIX.
uriTagValue function receives the actual uri and returns the uri tag value that will be used for the metrics with reactor.netty.Metrics.URI tag. For example instead of using the actual uri "/users/1" as uri tag value, templated uri "/users/{id}" can be used.
Note: It is strongly recommended to provide template-like form for the URIs. Without a conversion to a template-like form, each distinct URI leads to the creation of a distinct tag, which takes a lot of memory for the metrics.
Note: It is strongly recommended applications to configure an upper limit for the number of the URI tags. For example:
  Metrics.globalRegistry
         .config()
         .meterFilter(MeterFilter.maximumAllowableTags(HTTP_SERVER_PREFIX, URI, 100, MeterFilter.deny()));

By default metrics are not enabled.
Params:
enable – true enables metrics collection; false disables it uriTagValue – a function that receives the actual uri and returns the uri tag value that will be used for the metrics with reactor.netty.Metrics.URI tag
Returns:
a new HttpServer
Since:
0.9.7
public final HttpServer metrics(boolean enable, Function<String, String> uriTagValue) {
		if (enable) {
			if (!Metrics.isMicrometerAvailable() && !Metrics.isTracingAvailable()) {
				throw new UnsupportedOperationException(
						"To enable metrics, you must add the dependencies to `io.micrometer:micrometer-core`" +
								" and `io.micrometer:micrometer-tracing` to the class path first");
			}
看到源码注释:
Note: It is strongly recommended to provide template-like form for the URIs. Without a conversion to a template-like form, each distinct URI leads to the creation of a distinct tag, which takes a lot of memory for the metrics
意思是说需要为uri设置一个tag,如果不设置就会导致所有的uri都会生成一个mertric,从而占用大量内存,找到根因了,修改后的代码如下
@Component
public class WebServerConfig  implements WebServerFactoryCustomizer<NettyReactiveWebServerFactory> {

    @Override
    public void customize(NettyReactiveWebServerFactory factory) {
        //暴露reactor.netty相关指标到端点/actuator/prometheus
        factory.addServerCustomizers(httpServer ->httpServer.metrics(true,(key)-> "uri" ));
    }
}
到此,问题解决,性能跑到和之前一样的数据。
题外话mertric
从端点/actuator/prometheus中看到,增加以上配置后新增的metric,可以监控uri的一些数据,我们这里只区分了method,因为我们的uri都是pathstyle的形式;
# HELP reactor_netty_http_server_data_sent_time_seconds_max
# TYPE reactor_netty_http_server_data_sent_time_seconds_max gauge
reactor_netty_http_server_data_sent_time_seconds_max{method="GET",status="200",uri="uri",} 0.0
reactor_netty_http_server_data_sent_time_seconds_max{method="GET",status="500",uri="uri",} 0.0
# HELP reactor_netty_http_server_data_sent_time_seconds
# TYPE reactor_netty_http_server_data_sent_time_seconds summary
reactor_netty_http_server_data_sent_time_seconds_count{method="GET",status="200",uri="uri",} 8309119.0
reactor_netty_http_server_data_sent_time_seconds_sum{method="GET",status="200",uri="uri",} 1846.175749456
reactor_netty_http_server_data_sent_time_seconds_count{method="GET",status="500",uri="uri",} 11.0
reactor_netty_http_server_data_sent_time_seconds_sum{method="GET",status="500",uri="uri",} 0.00846828
erver_data_sent_time_seconds_count{method="GET",status="500",uri="uri",} 11.0
reactor_netty_http_server_data_sent_time_seconds_sum{method="GET",status="500",uri="uri",} 0.00846828