背景
C++作为常用的程序开发语言之一,在程序开发中和交付阶段,程序员都需要花费大量的时间做代码调试。在特定的场合下,如果不能使用vscode用户交互友好的编译平台进行debug调试,那gdb调试工具的熟练掌握则尤为重要了。
博主在以往的开发经验中,当调试C/C++程序时候过度依赖于vscode这种编译平台,虽然知道gdb工具可以更快的帮助定位到像core dump这种崩溃程序,但一直懒得切换过来。最近被面试提问暴击,就意识到:要想把C++掌握的更好,这种底层调试工具的熟练掌握很重要。
GDB 全称“GNU symbolic debugger”,是 Linux 下常用的程序调试器。
一般来说,GDB主要帮助我们完成以下四个方面的功能:
- 启动你的程序,可以按照你的自定义的要求随心所欲的运行程序。
- 在某个指定的地方或条件下暂停程序。
- 当程序被停住时,可以检查此时你的程序中所发生的事。
- 在程序执行过程中修改程序中的变量或条件,将一个bug产生的影响修正从而测试其他bug。
使用GDB调试程序,有以下两点需要注意:
- 要使用GDB调试某个程序,该程序编译时必须加上编译选项
-g,否则该程序是不包含调试信息的; - GCC编译器支持
-O和-g一起参与编译。GCC编译过程对进行优化的程度可分为5个等级,分别为 :
GDB入门
1) 安装gdb
确保你的笔记本安装了gdb工具,linux下安装命令为
sudo apt-get install gdb2) 编译参数
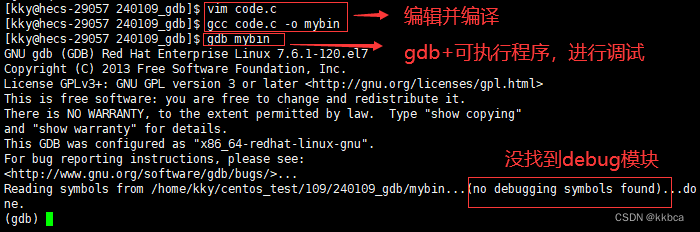
使用gdb调试程序,需要在编译时候加上 -g 选项,否则该程序不包含调试信息。如下编译一个test的可执行程序命令。
g++ -g -o test test.cpp3) gdb调试程序的三种方式
gdb ./test       # 绑定尚未运行的程序test
gdb attach <pid>  # 绑定正在运行的进程
gdb filename corename  #调试core dump文件
4) 调试指令及说明
| 命令名称 | 命令缩写 | 命令说明 |
|---|---|---|
| run | r | 运行一个待调试的程序 |
| continue | c | 让暂停的程序继续运行 |
| next | n | 运行到下一行 |
| step | s | 单步执行,遇到函数会进入 |
| until | u | 运行到指定行停下来 |
| finish | fi | 结束当前调用函数,回到上一层调用函数处 |
| return | return | 结束当前调用函数并返回指定值,到上一层函数调用处 |
| jump | j | 将当前程序执行流跳转到指定行或地址 |
| p | 打印变量或寄存器值 | |
| backtrace | bt | 查看当前线程的调用堆栈 |
| frame | f | 切换到当前调用线程的指定堆栈 |
| thread | thread | 切换到指定线程 |
| break | b | 添加断点 |
| tbreak | tb | 添加临时断点 |
| delete | d | 删除断点 |
| enable | enable | 启用某个断点 |
| disable | disable | 禁用某个断点 |
| watch | watch | 监视某一个变量或内存地址的值是否发生变化 |
| list | l | 显示源码 |
| info | i | 查看断点 / 线程等信息 |
| ptype | ptype | 查看变量类型 |
| disassemble | dis | 查看汇编代码 |
| set args | set args | 设置程序启动命令行参数 |
| show args | show args | 查看设置的命令行参数 |
quit |
q | 退出gdb程序 |
GDB调试core文件
笔者环境:ubuntu20.04
1)打开生成core dump文件限制
查看是否打开coredump功能, ulimit -c输出0表示未打开。可在后面跟具体的数字,或者unlimited设置core文件大小不受限。
$ ulimit -c   //未设置之前
0
$ ulimit -c 1024 //core文件最大1024字节
$ ulimit -c unlimited    //大小不受限
但是上面这种方法,必须在可执行程序的终端下,否则重新打开终端,或者重启电脑后就不管用了,不管用的表现就是,有core dump问题,但是在指定路径未生成core文件。
用如下方法,可以永久设置生成core文件。
$ vim .bashrc

ulimit -c unlimited  #在bashrc文件中写入这行指令
$ source .bashrc
2) 设置core文件存储路径
因为ubuntu的保护机制,查看core_pattern,会输出如下代表管道的|信息,这样的话无法生成有效的core文件
$ cat /proc/sys/kernel/core_pattern
|/usr/share/apport/apport %p %s %c %d %P %E 需要先修改/etc/default/apport文件,将enabled 设置为0。然后执行如下命令,将coredump文件路径修改为/var/core/下面。
$ sudo vim /etc/sysctl.conf

kernel.core_pattern = /var/core/core_%e_%p   #添加这一行内容

$ sudo sysctl -p  #使上面修改生效
3) 调试core文件
调用方式
gdb test /tmp/core/core_test_4314 #gdb 可执行程序 core dump文件进入调试程序,就能直接看到程序退出位置在第8行 *p=10位置
通过bt 命令,看到当前退出位置的调用栈有#0 ,#1两级,
通过f 0到达0的调用栈,list显示源代码查看
$ gdb test /tmp/core/core_test_9033
GNU gdb (Ubuntu 9.2-0ubuntu1~20.04.1) 9.2
Copyright (C) 2020 Free Software Foundation, Inc.
License GPLv3+: GNU GPL version 3 or later <http://gnu.org/licenses/gpl.html>
This is free software: you are free to change and redistribute it.
There is NO WARRANTY, to the extent permitted by law.
Type "show copying" and "show warranty" for details.
This GDB was configured as "x86_64-linux-gnu".
Type "show configuration" for configuration details.
For bug reporting instructions, please see:
<http://www.gnu.org/software/gdb/bugs/>.
Find the GDB manual and other documentation resources online at:
    <http://www.gnu.org/software/gdb/documentation/>.

For help, type "help".
Type "apropos word" to search for commands related to "word"...
Reading symbols from test...
[New LWP 9033]
Core was generated by `./test'.
Program terminated with signal SIGSEGV, Segmentation fault.
#0  0x0000559f5b58d17d in PointDemo () at demo_core_dump.cpp:8
8	    *p=10;
(gdb) bt
#0  0x0000559f5b58d17d in PointDemo () at demo_core_dump.cpp:8
#1  0x0000559f5b58d193 in main () at demo_core_dump.cpp:14
(gdb) f 0
#0  0x0000559f5b58d17d in PointDemo () at demo_core_dump.cpp:8
8	    *p=10;
(gdb) l
3	using namespace std;
4
5	void PointDemo()
6	{
7	    int * p=0;
8	    *p=10;
9	}
10
11	int main()
12	{
test的源代码参考:
#include <iostream>

using namespace std;

void PointDemo()
{
    int * p=0;
    *p=10;
}

int main()
{

    PointDemo();
    return 0;
}
参考: