概念:
GDB(GNU Debugger)是一个用于调试程序的强大工具。它是GNU项目的一部分,支持多种编程语言,包括C、C++等。GDB 提供了一组命令和功能,允许跟踪检查程序的内部状态,跟踪代码的执行过程,以及定位和修复程序中的错误。
gdb和gdb sever
GDB(GNU Debugger)
- gdb 用于本地调试程序。它允许程序员查看程序的运行状态、检查变量和内存、设置断点等,以便在代码中找到和修复问题。
- 使用 gdb 时,你在本地计算机上运行 gdb,并且该调试器直接与正在调试的程序进行交互。
GDB Server(gdbserver)
- gdbserver 是 GDB 的另一部分,用于远程调试。它允许你在目标计算机上运行一个小型的 GDB 服务器,然后在本地计算机上运行gdb 与之连接。
- 通过 gdbserver,你可以在嵌入式系统或远程计算机上调试程序,而不需要将整个 GDB 调试器放在目标系统上。
- 这种分离的方法对于嵌入式系统等资源受限的环境非常有用,允许在目标系统上运行轻量级的 gdbserver,而在开发机上运行完整版的 gdb 进行调试。
作用
- 调试程序: GDB的主要作用是帮助程序员识别和解决程序中的错误(bugs)。它允许开发者在程序执行时停下来,检查变量的值,查看函数调用堆栈,设置断点,并逐步执行代码。
- 变量和内存查看:GDB 允许开发者检查程序运行时的变量的值和内存的内容。这对于理解程序的状态以及发现潜在问题非常有用。
- 设置断点: 开发者可以在程序中设置断点,使得程序在执行到达特定的位置时停下来。这有助于逐步调试程序并检查特定的代码段。
- 单步执行:GDB 允许开发者逐步执行程序,一次执行一行代码或一次执行一个函数。这对于追踪程序的执行流程非常有用。
- 追踪函数调用:GDB 能够跟踪程序中的函数调用,显示函数调用关系,帮助开发者理解程序的执行路径。
- 查找内存错误:GDB 能够帮助开发者查找程序中的内存错误,如访问未分配内存、内存溢出等问题。
- 多线程调试:GDB 支持调试多线程程序,允许开发者查看和调试不同线程的执行状态。
- 核心转储分析:当程序发生崩溃时,GDB 可以分析核心转储文件,帮助开发者定位问题的根本原因。
GDB和IDE差别
- 各有好处,并且IDE在不考虑环境的情况下,更容易上手
- 基于 Linux 服务器等的无图形界面开发,使用 Vim+GDB 可以在任意一台电脑上直接调试,不用花时间安装复杂的 IDE 环境。
主要包含如下区别:
- 命令行界面 vs 图形用户界面
- 功能的可视化和图形化展示
- 集成性和便利性
- 快捷键和工具栏
- 平台和语言支持
总体而言,使用 GDB 和使用 IDE 中的调试工具之间的选择通常取决于个人偏好、项目需求以及开发环境。
gdb 调试段错误代码demo
#include <stdio.h>

void accessInvalidMemory() {

    int *ptr = NULL; // 故意将指针设置为NULL
    *ptr = 42;       // 试图访问NULL指针
}
int main() {

    accessInvalidMemory(); // 调用会导致Segmentation fault的函数
    return 0;
}
定位流程与操作
@ubuntu:$ gcc -g Segmentation_fault.c -o Segmentation_fault
@ubuntu:GDB_debug$ gdb ./Segmentation_fault -q
Reading symbols from ./Segmentation_fault...done.
(gdb) b main
Breakpoint 1 at 0x617: file Segmentation_fault.c, line 9.
(gdb) list
1       #include <stdio.h>
2
3       void accessInvalidMemory() {

4           int *ptr = NULL; // 故意将指针设置为NULL
5           *ptr = 42;       // 试图访问NULL指针
6       }
7
8       int main() {

9           accessInvalidMemory(); // 调用会导致Segmentation fault的函数
10          return 0;
(gdb) r
Starting program: GDB_debug/Segmentation_fault

Breakpoint 1, main () at Segmentation_fault.c:9
9           accessInvalidMemory(); // 调用会导致Segmentation fault的函数
(gdb) s
accessInvalidMemory () at Segmentation_fault.c:4
4           int *ptr = NULL; // 故意将指针设置为NULL
(gdb) n
5           *ptr = 42;       // 试图访问NULL指针
(gdb) n

Program received signal SIGSEGV, Segmentation fault.
0x000055555555460a in accessInvalidMemory () at Segmentation_fault.c:5
5           *ptr = 42;       // 试图访问NULL指针
(gdb) bt
#0  0x000055555555460a in accessInvalidMemory () at Segmentation_fault.c:5
#1  0x0000555555554621 in main () at Segmentation_fault.c:9
(gdb) n
Program terminated with signal SIGSEGV, Segmentation fault.
The program no longer exists.
(gdb) n
The program is not being run.
结论
查看调用栈
(gdb) bt
#0  0x000055555555460a in accessInvalidMemory () at Segmentation_fault.c:5
#1  0x0000555555554621 in main () at Segmentation_fault.c:9
问题出在:函数accessInvalidMemory,代码的第五行
说明与解释:
- bt是backtrace的缩写,可以查看调用栈
- r是run的缩写
- n是next的缩写
- s是step的缩写
- b 是break的缩写
- quit 退出gdb调试,缩写为q
为什么不一直用next?还用step?
- next执行当前函数的所有指令,而step可以让进入段错误函数后再第一行停下来,可以定位到具体到某一行出现的问题
GDB多线程调试
#include <stdio.h>
#include <pthread.h>
#include <unistd.h>

void *thread_function(void *arg) {

    for (int i = 0; i < 5; ++i) {

        printf("Thread %ld: Iteration %d\n", (long)arg, i);
        sleep(1);
    }
    return NULL;
}

int main() {

    pthread_t thread1, thread2;

    // 创建两个线程
    pthread_create(&thread1, NULL, thread_function, (void *)1);
    pthread_create(&thread2, NULL, thread_function, (void *)2);

    // 等待线程结束
    pthread_join(thread1, NULL);
    pthread_join(thread2, NULL);

    return 0;
}
编译
gcc -g multithread_demo.c -o multithread_demo -lpthread
执行
gdb ./multithread_demo -q
想要完成的调试方法
1、查看整体进程中的线程执行结果:
@ubuntu:$ gdb ./multithread_demo -q
Reading symbols from ./multithread_demo...done.
(gdb) b main
Breakpoint 1 at 0x81d: file multithread_demo.c, line 13.
(gdb) run
Starting program: GDB_debug/multithread_demo
[Thread debugging using libthread_db enabled]
Using host libthread_db library "/lib/x86_64-linux-gnu/libthread_db.so.1".
Breakpoint 1, main () at multithread_demo.c:13
13      int main() {

(gdb) n
17          pthread_create(&thread1, NULL, thread_function, (void *)1);
(gdb) n
[New Thread 0x7ffff77c2700 (LWP 335)]
18          pthread_create(&thread2, NULL, thread_function, (void *)2);
(gdb) info threads
Id   Target Id         Frame
- 1    Thread 0x7ffff7fdb740 (LWP 130537) "multithread_dem" main () at multithread_demo.c:18
(gdb) n
Thread 1: Iteration 1
Thread 2: Iteration 0
Thread 1: Iteration 2
Thread 2: Iteration 1
Thread 1: Iteration 3
Thread 2: Iteration 2
Thread 1: Iteration 4
Thread 2: Iteration 3
[Thread 0x7ffff77c2700 (LWP 335) exited]
22          pthread_join(thread2, NULL);
(gdb) n
Thread 2: Iteration 4
[Thread 0x7ffff6fc1700 (LWP 1407) exited]
24          return 0;
(gdb) n
25      }
(gdb) n
[Inferior 1 (process 130537) exited normally]
(gdb) n
The program is not being run.
2、子线程被创建后,gdb跟踪子线程及主线程
@ubuntu:GDB_debug$ gdb ./multithread_demo -q
Reading symbols from ./multithread_demo...done.
(gdb) set detach-on-fork off
(gdb) b main
Breakpoint 1 at 0x81d: file multithread_demo.c, line 13.
(gdb) run
Starting program: GDB_debug/multithread_demo
[Thread debugging using libthread_db enabled]
13      int main() {

(gdb) n
17          pthread_create(&thread1, NULL, thread_function, (void *)1);
(gdb) n
[New Thread 0x7ffff77c2700 (LWP 9522)]
Thread 1: Iteration 0
18          pthread_create(&thread2, NULL, thread_function, (void *)2);
(gdb) n
[New Thread 0x7ffff6fc1700 (LWP 9523)]
Thread 2: Iteration 0
Thread 2: Iteration 1
Thread 2: Iteration 2
Thread 2: Iteration 3
Thread 2: Iteration 4
8               sleep(1);
(gdb)
6           for (int i = 0; i < 5; ++i) {

(gdb)
7               printf("Thread %ld: Iteration %d\n", (long)arg, i);
(gdb)
Thread 1: Iteration 1
8               sleep(1);
(gdb)
6           for (int i = 0; i < 5; ++i) {

(gdb)
7               printf("Thread %ld: Iteration %d\n", (long)arg, i);
(gdb)
Thread 1: Iteration 2
8               sleep(1);
(gdb)
6           for (int i = 0; i < 5; ++i) {

(gdb)
7               printf("Thread %ld: Iteration %d\n", (long)arg, i);
(gdb)
Thread 1: Iteration 3
8               sleep(1);
(gdb)
6           for (int i = 0; i < 5; ++i) {

(gdb)
7               printf("Thread %ld: Iteration %d\n", (long)arg, i);
(gdb)
Thread 1: Iteration 4
8               sleep(1);
(gdb)
6           for (int i = 0; i < 5; ++i) {

(gdb)
10          return NULL;
(gdb)
11      }
命令解释
- set detach-on-fork off 告诉 GDB 在子进程(或线程)分离时不要自动分离调试器,默认情况下,GDB 会在程序中发生
fork 时自动分离调试器,这可能导致你失去对子进程的控制,所以我一般会设置为off - show detach-on-fork可以看当前的设置状态
GDB多进程调试
#include <stdio.h>
#include <unistd.h>
int main()
{

    pid_t pid = fork();
    if(pid == 0)
    {

        int num =10;
        while(num==10){

            sleep(2);
            printf("this 1is child,pid = %d\n",getpid());
        }

        printf("this 2is child,pid = %d\n",getpid());
        printf("this 3is child,pid = %d\n",getpid());
    }
    else
    {

            int mnum=5;
            while(mnum==5){

            sleep(5);
            printf("this 4is parent,pid = %d\n",getpid());
        }

    }
    return 0;
}
编译
gcc -g multiprocess_demo_2.c -o multiprocess_demo_2
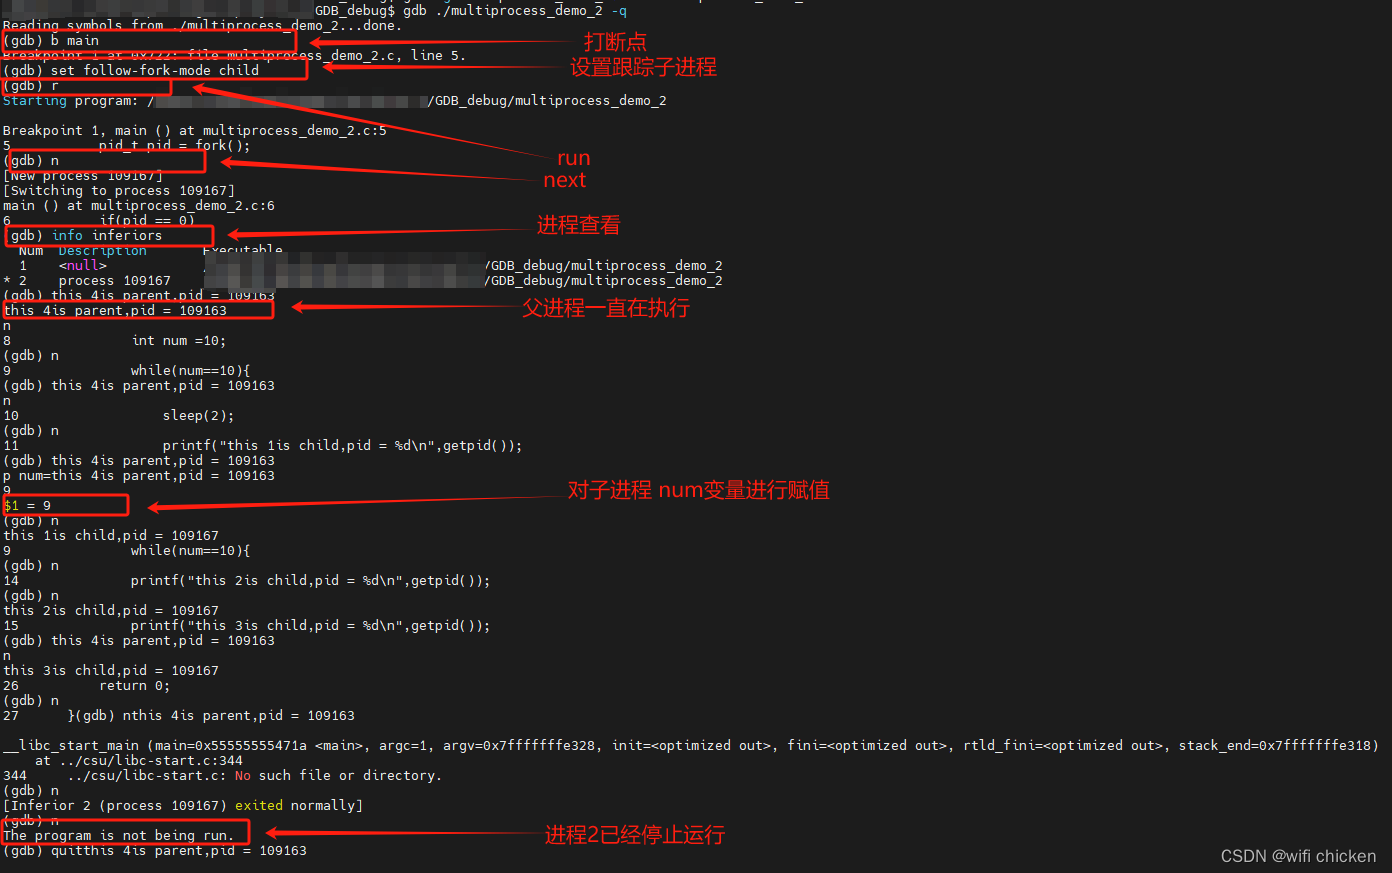
gdb 跟踪子进程:
@ubuntu:GDB_debug$ gcc -g multiprocess_demo_2.c -o multiprocess_demo_2
@ubuntu:GDB_debug$ gdb ./multiprocess_demo_2 -q
Reading symbols from ./multiprocess_demo_2...done.
(gdb) b main
Breakpoint 1 at 0x722: file multiprocess_demo_2.c, line 5.
(gdb) set follow-fork-mode child
(gdb) r
Starting program: /home/xj/Desktop/huangrui/project_1/GDB_debug/multiprocess_demo_2

Breakpoint 1, main () at multiprocess_demo_2.c:5
5           pid_t pid = fork();
(gdb) n
[New process 109167]
[Switching to process 109167]
main () at multiprocess_demo_2.c:6
6           if(pid == 0)
(gdb) info inferiors
  Num  Description       Executable
  1    <null>            GDB_debug/multiprocess_demo_2
* 2    process 109167    GDB_debug/multiprocess_demo_2
(gdb) this 4is parent,pid = 109163
this 4is parent,pid = 109163
n
8               int num =10;
(gdb) n
9               while(num==10){

(gdb) this 4is parent,pid = 109163
n
10                  sleep(2);
(gdb) n
11                  printf("this 1is child,pid = %d\n",getpid());
(gdb) this 4is parent,pid = 109163
p num=this 4is parent,pid = 109163
9
$1 = 9
(gdb) n
this 1is child,pid = 109167
9               while(num==10){

(gdb) n
14              printf("this 2is child,pid = %d\n",getpid());
(gdb) n
this 2is child,pid = 109167
15              printf("this 3is child,pid = %d\n",getpid());
(gdb) this 4is parent,pid = 109163
n
this 3is child,pid = 109167
26          return 0;
(gdb) n
27      }(gdb) nthis 4is parent,pid = 109163

__libc_start_main (main=0x55555555471a <main>, argc=1, argv=0x7fffffffe328, init=<optimized out>, fini=<optimized out>, rtld_fini=<optimized out>, stack_end=0x7fffffffe318)
    at ../csu/libc-start.c:344
344     ../csu/libc-start.c: No such file or directory.
(gdb) n
[Inferior 2 (process 109167) exited normally]
(gdb) n
The program is not being run.
(gdb) quitthis 4is parent,pid = 109163
set follow-fork-mode的作用:set follow-fork-mode parent 是 GDB 的一个命令,用于在多进程调试时控制在 fork() 调用之后 GDB 应该跟踪哪个进程。
- set follow-fork-mode parent: 设置 GDB 在 fork()调用后继续跟踪父进程,而不是默认的子进程。这意味着在程序执行 fork() 后,GDB将继续调试父进程,而子进程将被分离(detach)。
- set follow-fork-mode child: 设置 GDB 在 fork()调用后继续跟踪子进程,而不是默认的父进程。这意味着在程序执行 fork() 后,GDB 将继续调试子进程,而父进程将被分离。
- set follow-fork-mode ask: 设置 GDB 在 fork() 调用后询问用户要跟踪哪个进程。GDB 将在每次 fork() 发生时等待用户输入,以确定是跟踪父进程还是子进程。
解释:
补充:
- 在 GDB 中,使用 p 命令(print 的缩写)不仅可以用来查看变量的值,还可以用来修改变量的值。当你执行 p num=9
时,实际上是在给变量 num 赋予新的值。
前面是单子进程的调试
那如果我父进程创建多个子进程,应该如何调试呢?
#include <stdio.h>
#include <unistd.h>

int main() {

    pid_t pid1, pid2;

    pid1 = fork();
    if (pid1 == 0) {

        // 子进程1
        printf("Child Process 1 (PID: %d)\n", getpid());
        // 子进程1的工作
    } else {

        pid2 = fork();
        if (pid2 == 0) {

            // 子进程2
            printf("Child Process 2 (PID: %d)\n", getpid());
            // 子进程2的工作
        } else {

            // 父进程
            printf("Parent Process (PID: %d)\n", getpid());
            // 父进程的工作
            // 父进程通常需要等待子进程结束
            waitpid(pid1, NULL, 0);
            waitpid(pid2, NULL, 0);
        }
    }
    return 0;
}
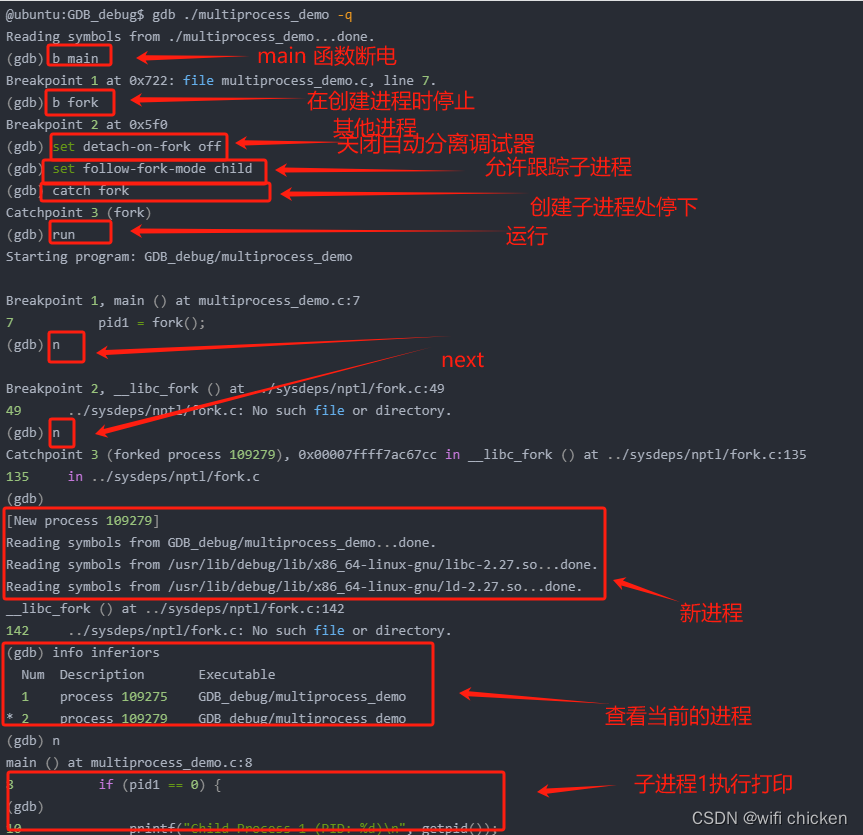
调试步骤(步骤有删减):
@ubuntu:GDB_debug$ gdb ./multiprocess_demo -q
Reading symbols from ./multiprocess_demo...done.
(gdb) b main
Breakpoint 1 at 0x722: file multiprocess_demo.c, line 7.
(gdb) b fork
Breakpoint 2 at 0x5f0
(gdb) set detach-on-fork off
(gdb) set follow-fork-mode child
(gdb) catch fork
Catchpoint 3 (fork)
(gdb) run
Starting program: GDB_debug/multiprocess_demo
Breakpoint 1, main () at multiprocess_demo.c:7
7 pid1 = fork();
(gdb) n
Breakpoint 2, __libc_fork () at ../sysdeps/nptl/fork.c:49
49 ../sysdeps/nptl/fork.c: No such file or directory.
(gdb) n
Catchpoint 3 (forked process 109279), 0x00007ffff7ac67cc in __libc_fork () at ../sysdeps/nptl/fork.c:135
135 in ../sysdeps/nptl/fork.c
(gdb)
[New process 109279]
Reading symbols from GDB_debug/multiprocess_demo...done.
Reading symbols from /usr/lib/debug/lib/x86_64-linux-gnu/libc-2.27.so...done.
Reading symbols from /usr/lib/debug/lib/x86_64-linux-gnu/ld-2.27.so...done.
__libc_fork () at ../sysdeps/nptl/fork.c:142
142 ../sysdeps/nptl/fork.c: No such file or directory.
(gdb) info inferiors
Num Description Executable
1 process 109275 GDB_debug/multiprocess_demo
* 2 process 109279 GDB_debug/multiprocess_demo
(gdb) n
main () at multiprocess_demo.c:8
8 if (pid1 == 0) {
(gdb)
10 printf("Child Process 1 (PID: %d)\n", getpid());
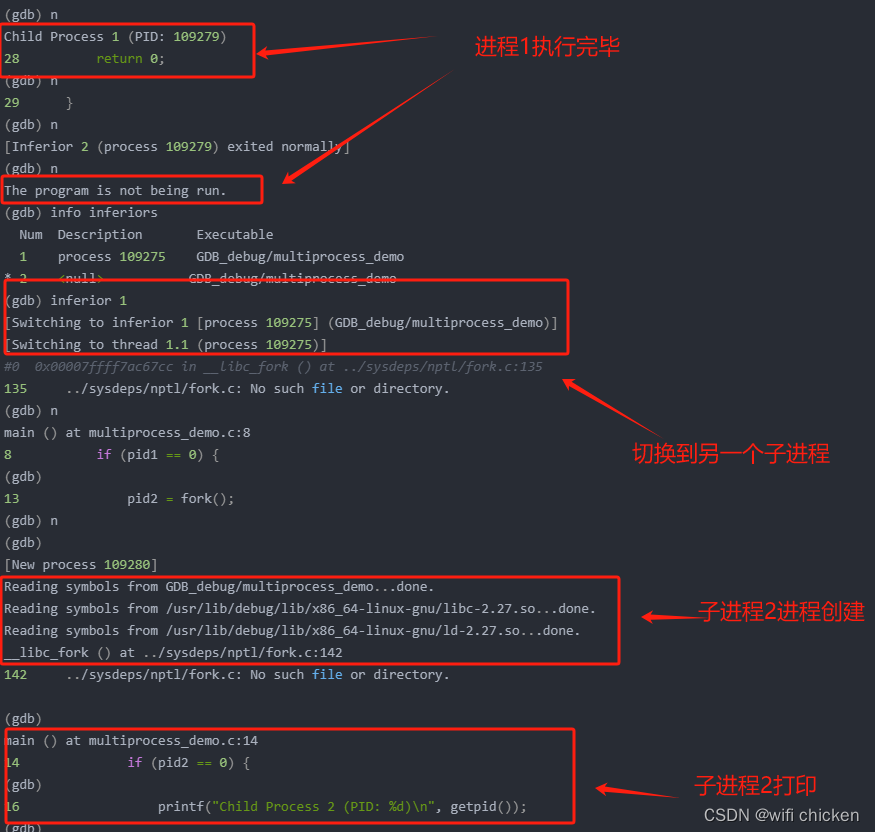
(gdb) n
Child Process 1 (PID: 109279)
28 return 0;
(gdb) n
29 }
(gdb) n
[Inferior 2 (process 109279) exited normally]
(gdb) n
The program is not being run.
(gdb) info inferiors
Num Description Executable
1 process 109275 GDB_debug/multiprocess_demo
* 2 <null> GDB_debug/multiprocess_demo
(gdb) inferior 1
[Switching to inferior 1 [process 109275] (GDB_debug/multiprocess_demo)]
[Switching to thread 1.1 (process 109275)]
#0 0x00007ffff7ac67cc in __libc_fork () at ../sysdeps/nptl/fork.c:135
135 ../sysdeps/nptl/fork.c: No such file or directory.
(gdb) n
main () at multiprocess_demo.c:8
8 if (pid1 == 0) {
(gdb)
13 pid2 = fork();
(gdb) n
(gdb)
[New process 109280]
Reading symbols from GDB_debug/multiprocess_demo...done.
Reading symbols from /usr/lib/debug/lib/x86_64-linux-gnu/libc-2.27.so...done.
Reading symbols from /usr/lib/debug/lib/x86_64-linux-gnu/ld-2.27.so...done.
__libc_fork () at ../sysdeps/nptl/fork.c:142
142 ../sysdeps/nptl/fork.c: No such file or directory.
(gdb)
main () at multiprocess_demo.c:14
14 if (pid2 == 0) {
(gdb)
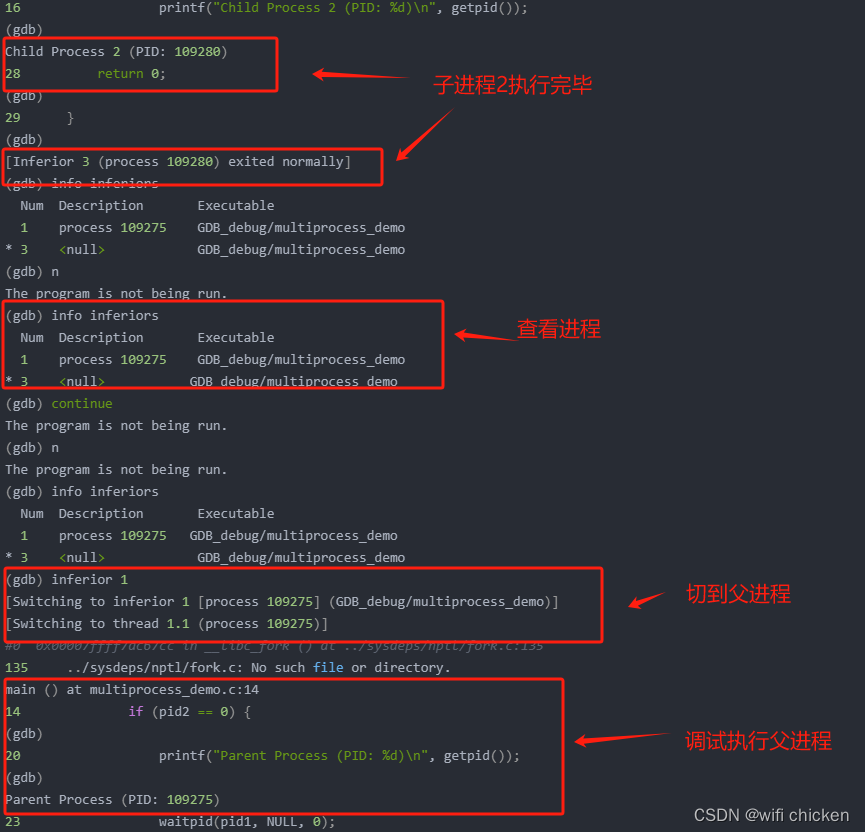
16 printf("Child Process 2 (PID: %d)\n", getpid());
(gdb)
Child Process 2 (PID: 109280)
28 return 0;
(gdb)
29 }
(gdb)
[Inferior 3 (process 109280) exited normally]
(gdb) info inferiors
Num Description Executable
1 process 109275 GDB_debug/multiprocess_demo
* 3 <null> GDB_debug/multiprocess_demo
(gdb) n
The program is not being run.
(gdb) info inferiors
Num Description Executable
1 process 109275 GDB_debug/multiprocess_demo
* 3 <null> GDB_debug/multiprocess_demo
(gdb) continue
The program is not being run.
(gdb) n
The program is not being run.
(gdb) info inferiors
Num Description Executable
1 process 109275 GDB_debug/multiprocess_demo
* 3 <null> GDB_debug/multiprocess_demo
(gdb) inferior 1
[Switching to inferior 1 [process 109275] (GDB_debug/multiprocess_demo)]
[Switching to thread 1.1 (process 109275)]
#0 0x00007ffff7ac67cc in __libc_fork () at ../sysdeps/nptl/fork.c:135
135 ../sysdeps/nptl/fork.c: No such file or directory.
main () at multiprocess_demo.c:14
14 if (pid2 == 0) {
(gdb)
20 printf("Parent Process (PID: %d)\n", getpid());
(gdb)
Parent Process (PID: 109275)
23 waitpid(pid1, NULL, 0);
(gdb) n
24 waitpid(pid2, NULL, 0);
(gdb) n
28 return 0;
(gdb) info inferiors
Num Description Executable
* 1 process 109275 GDB_debug/multiprocess_demo
(gdb) n
29 }
(gdb) n
[Inferior 1 (process 109275) exited normally]
(gdb) n
The program is not being run.
如下是对上面的进行的备注:
再次逻辑与命令说明
- set follow-fork-mode child:fork后跟踪子进程
- set detach-on-fork off不自动分离调试器
- break fork 设置断点在 fork() 处
- catch fork 在 fork() 处停下,并切换到子进程
- continue 继续执行,这将在子进程中停下
- info inferiors 查看当前进程
- inferiors 2 切换到指定进程,例如第二个进程
这样就可以单独的调试某个进程了
gdb sever的连接调试
在这里我简单说明下连接的三个基本流程流程:
- 在目标机器上启动 GDB Server:gdbserver :1234 /path/to/your/target/program
- 在本地机器上启动 GDB 并连接到 GDB Server:gdb /path/to/your/target/program,在 GDB 中连接到 GDB Server:target remote <target_system_ip>:1234
- 在本地 GDB 中进行调试
这个内容的实操我会在后面的文档中体现出来,一篇文档内容过多,比较冗余