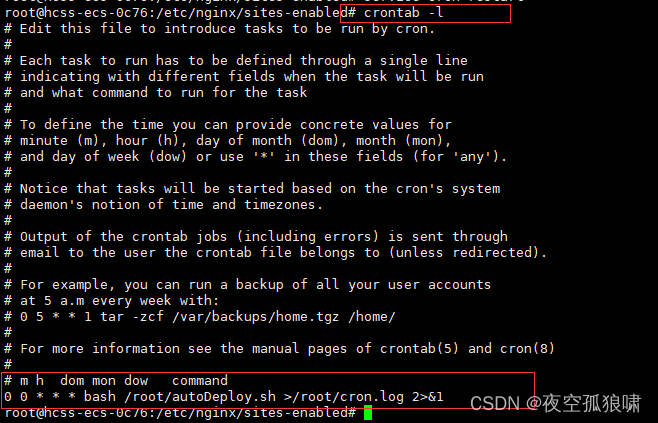
echarts设置tooltip的层级
    tooltip: {

          trigger: "axis",
          extraCssText: 'z-index:3', // 修改层级
          borderColor: "rgba(0, 170, 255)",
        },
完整的option示例如下:
option = {
tooltip: {
trigger: "axis",
extraCssText: 'z-index:3',
axisPointer: {
// 方法一
type: "shadow", // 默认为直线,可选为:'line' | 'shadow'
shadowStyle: {
color: "rgba(41, 95, 204, 0.2)",
},
},
borderColor: "rgba(0, 170, 255)", // 边框颜色
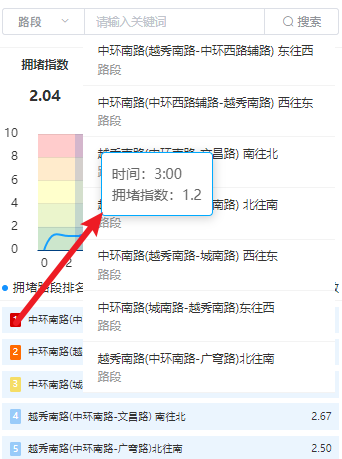
formatter: function (params) {
return [
"时间:" + params[0].name + ":00",
"拥堵指数:" + params[0].value,
].join("<br/>");
},
}, // 坐标轴指示器配置
textStyle: {
color: "#333", // xy轴的提示文字颜色,不包含背景刻度线
},
color: ["#1492FF"],
grid: {
top: "20px",
left: "50px",
right: "20px",
bottom: "25px",
},
xAxis: [
{
type: "category",
data: this.chartsData.time,
axisLine: {
show: true,
lineStyle: {
color: "#004080",
// width: 0,
// type: "solid",
}, // x轴线的颜色以及宽度
},
// axisLabel: {
// show: true,
// textStyle: {
// color: "rgba(255, 255, 255, 0.3)",
// }
// }, // x轴文字的配置
splitLine: {
show: false,
lineStyle: {
}, // 分割线配置
},
axisTick: {
show: false,
}, // x轴的刻度线
},
],
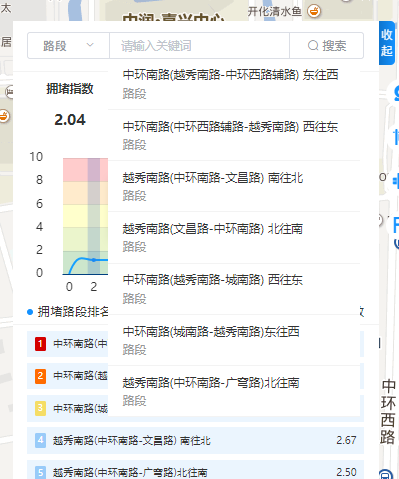
yAxis: [
{
type: "value",
max: 10,
splitLine: {
show: true,
lineStyle: {
color: "#333",
opacity: 0.1,
}, // 设置横向的线的颜色
},
axisLabel: {
show: true,
margin: 20,
// textStyle: {
// color: "rgba(255, 255, 255, 0.3)",
// }, // y轴的字体配置
},
splitArea: {
show: true,
areaStyle: {
color: [
"rgb(0, 128, 0, .2)",
"rgb(153, 204, 0, .2)",
"rgb(255, 255, 0, .2)",
"rgb(255, 153, 0, .2)",
"rgb(255, 0, 0, .2)",
],
},
},
},
],
series: [
{
data: this.chartsData.roadNorm,
type: "line",
smooth: true,
symbolSize: 0, // 设置圆点大小为 0,即不显示圆点
},
],
};


![[大厂实践] 重新发明后端子集](https://img-blog.csdnimg.cn/img_convert/714e2b59c8b15da8dbccced6c64d4886.png)