一 前言
数据链路图是所有数据开发产品中必备的一项功能,不仅仅是因为它提供了数据开发过程的可视化数据链路,还因为它给数据开发的调试,溯源,提供着不可估量的作用。
近期花一个多月做了一个数据血缘图,由于涉及到一些图算法和盒子模型的知识点,具有一定的学习借鉴价值,同时应各位同事的要求,在此做一下分享。
(PS:这次分享终于不再是GitLab CI/CD主题了😑)
二 需求分析
需求描述:
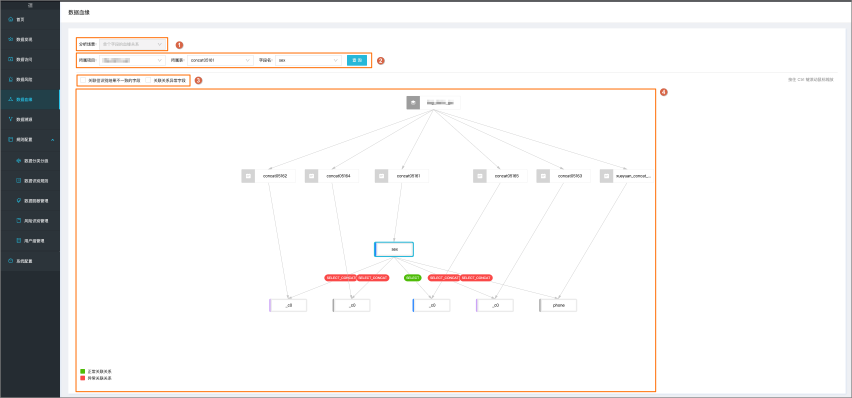
顶部为搜索输入框,可以搜索表,任务,API,应用四大类。搜索后,下部出现对应的该实体的链路图,链路中的节点需要分组,分层显示到对应的区域。节点第一次加载的规则是,只显示上游到该实体(又叫中心节点,有明显颜色区分)的链路,下游数据需要点击才展开,此外中心节点的父节点的子节点(中心节点除外)不加载。点击加号图标,加载展开对应的上级,下级数据。对于跨层的作业使用红色线链接,以示区分。
难点:
- 组内排版:如果群组内的节点有连线,则节点需要动态排成多列,多行。组内关系决定多少行,多少列,最终也决定群组宽高。
- 坐标计算 :从左到右,根据盒子模型,定义的常量和行列 来计算每个分组坐标与大小,每个节点的坐标
- 展开,收起与之相关的节点状态:左右均可展开,收起。状态管理,图标维护,增加去重加载。牵扯上下游节点遍历,相关节点状态维护
从哲学角度讲:主要矛盾对事物发展起决定作用,这三个难点问题也决定了这个需求能不能做,能做到那种程度。
三 需求价值
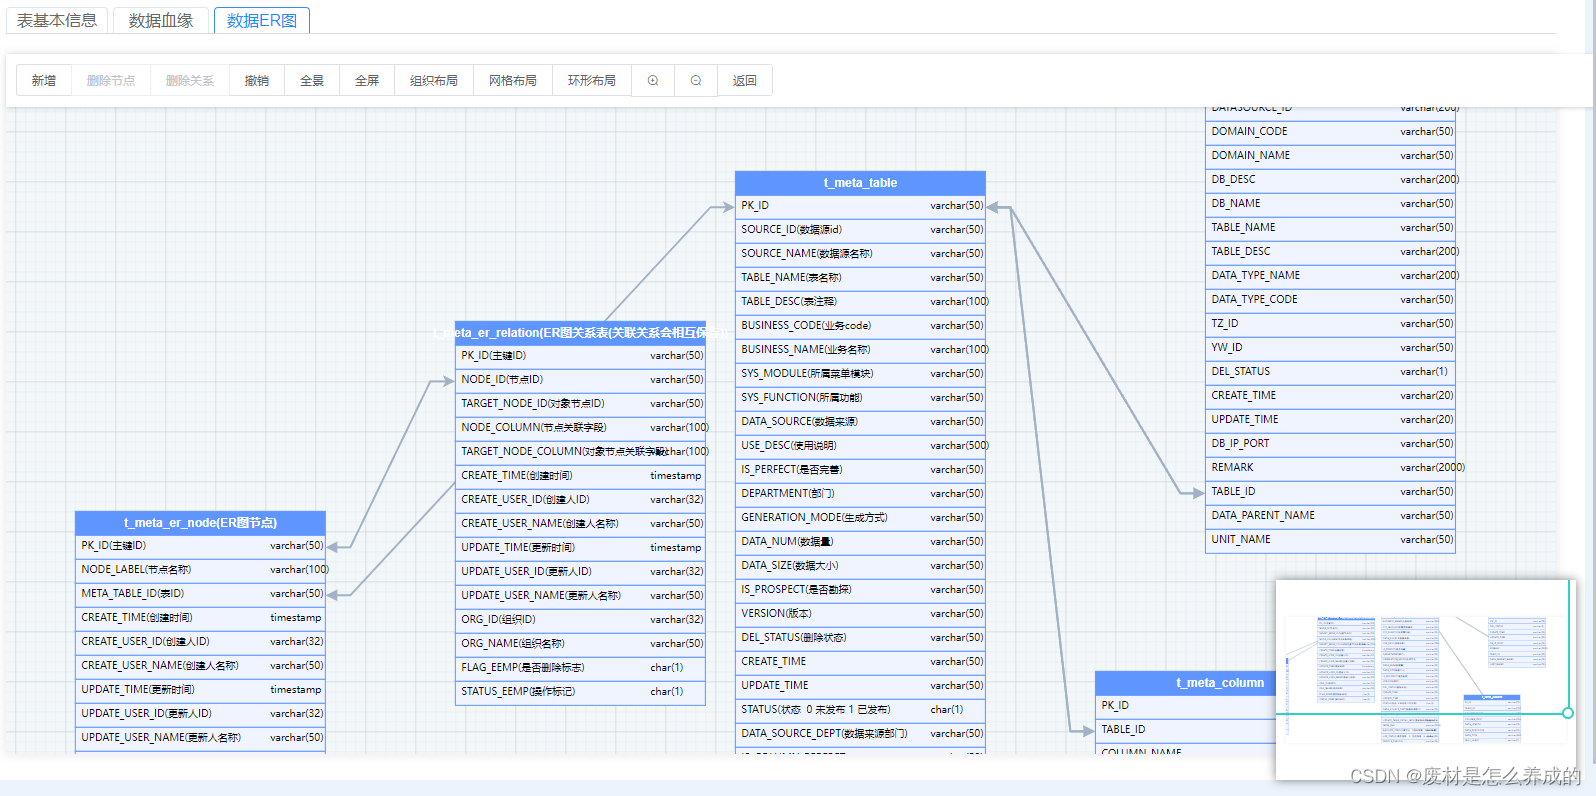
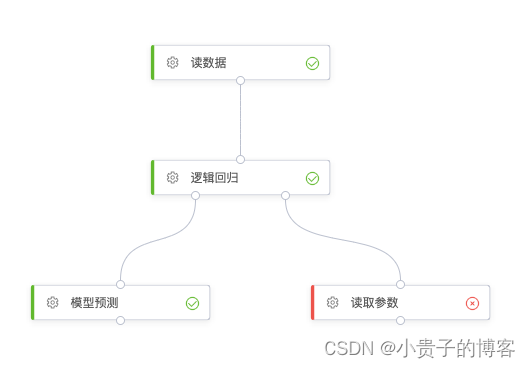
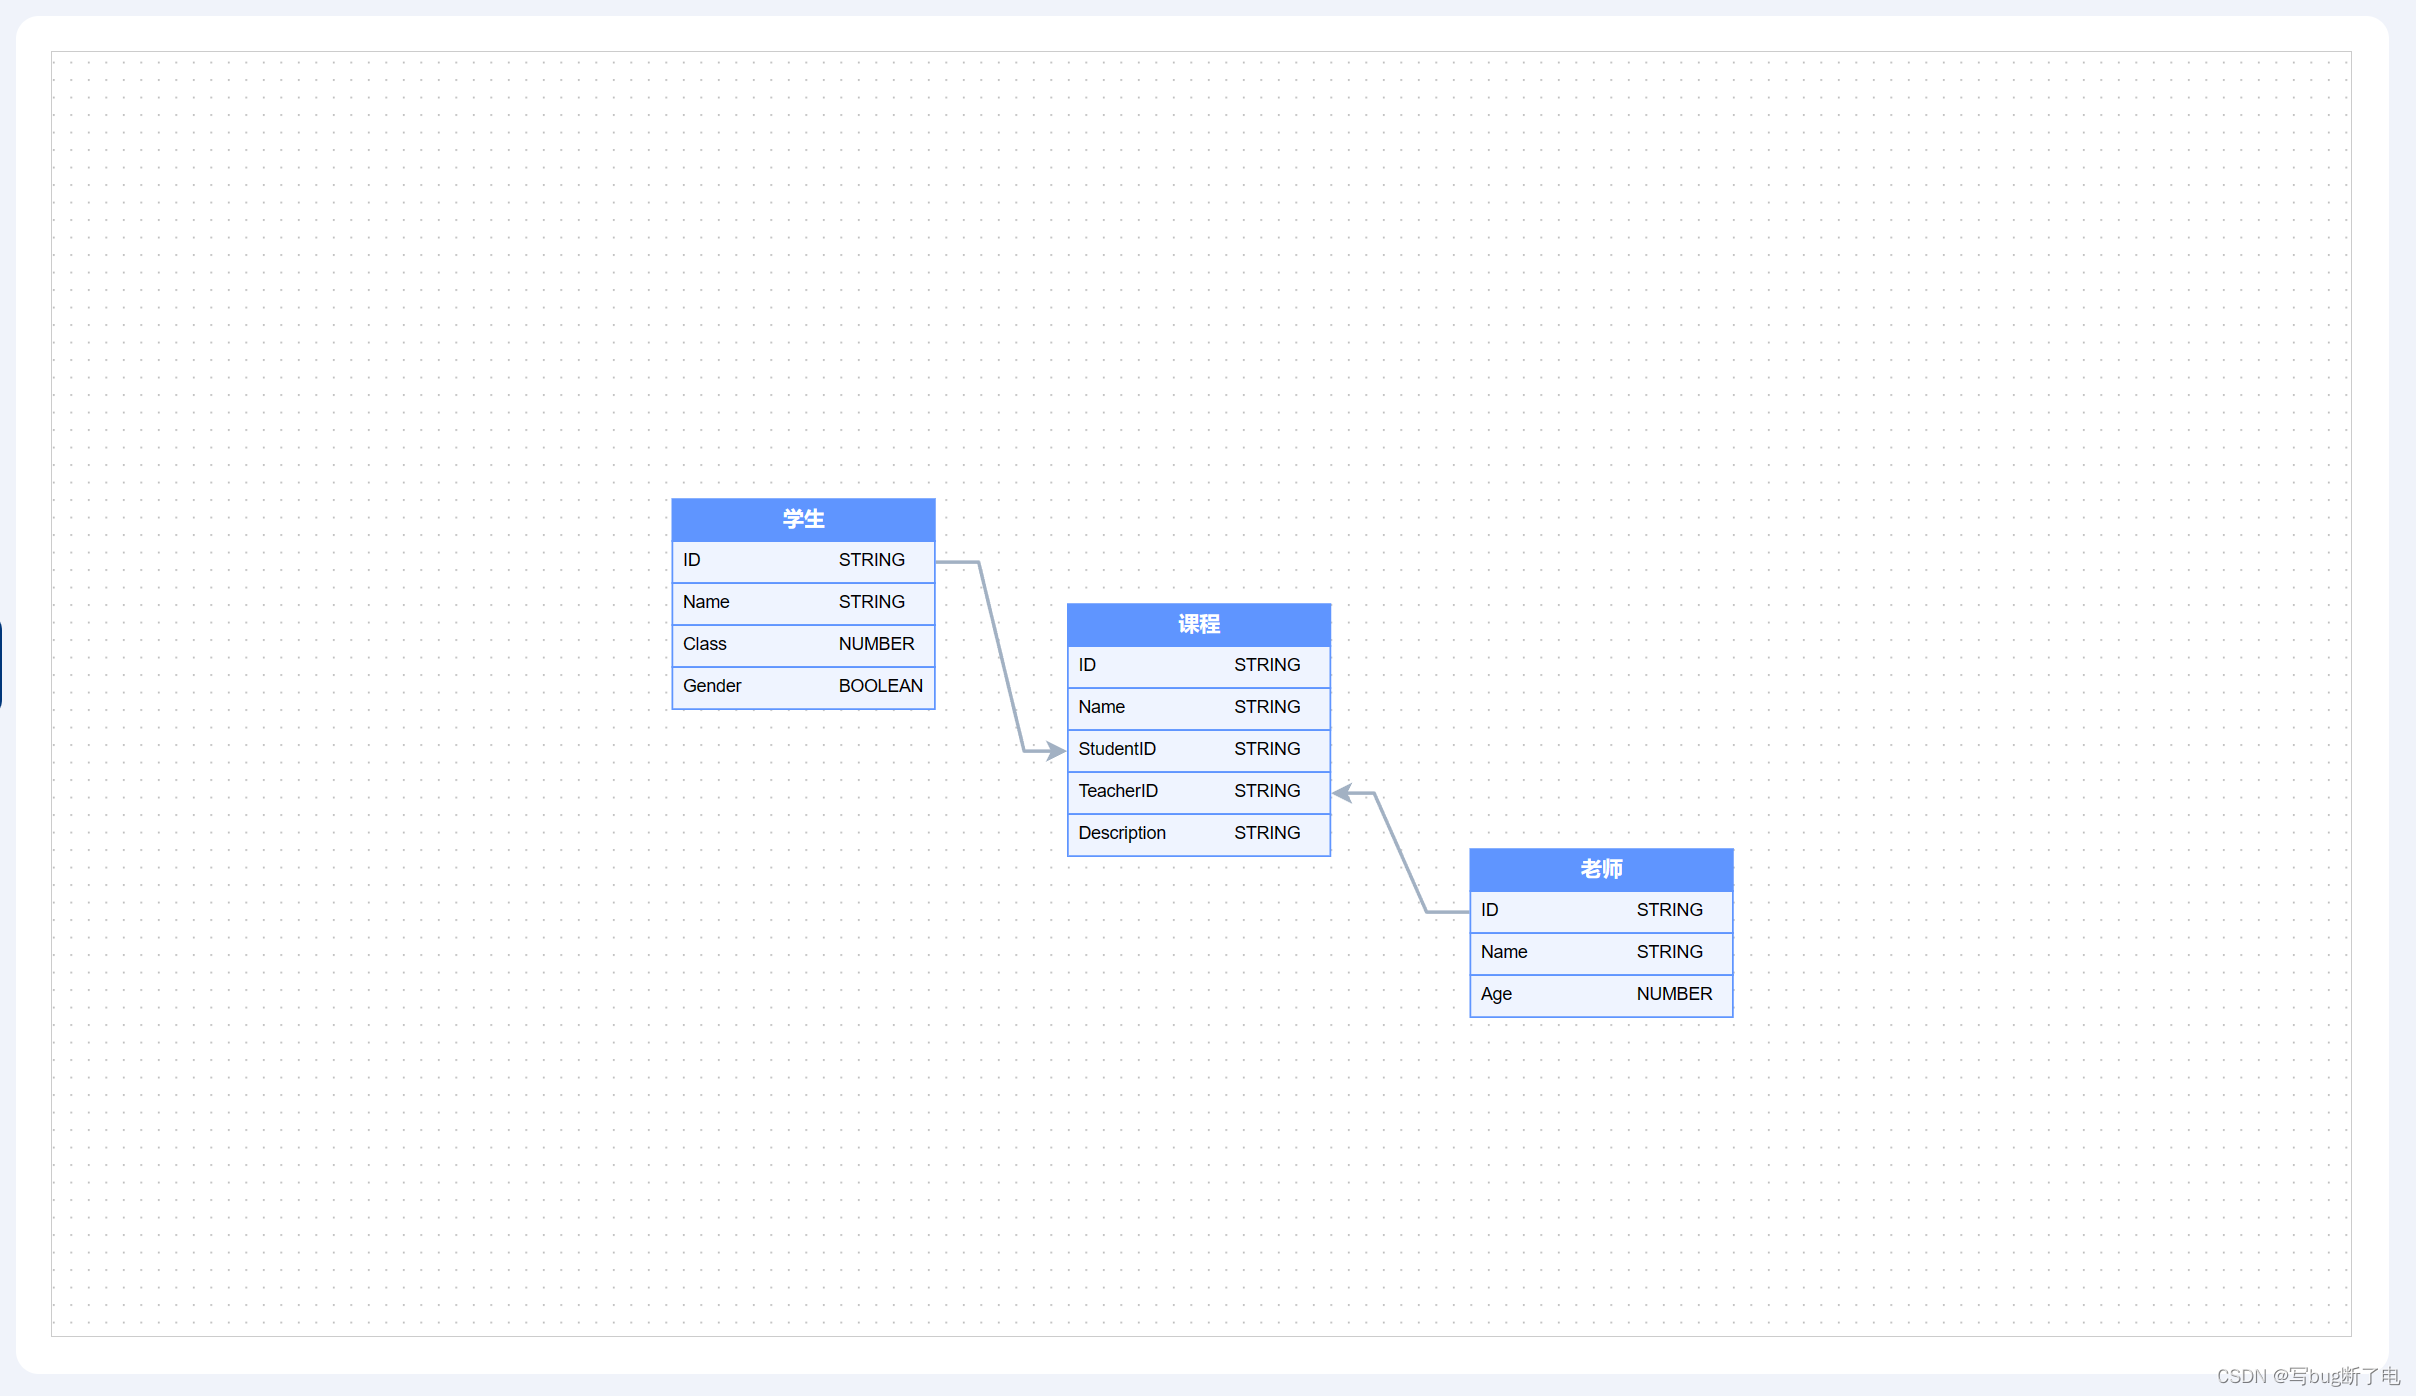
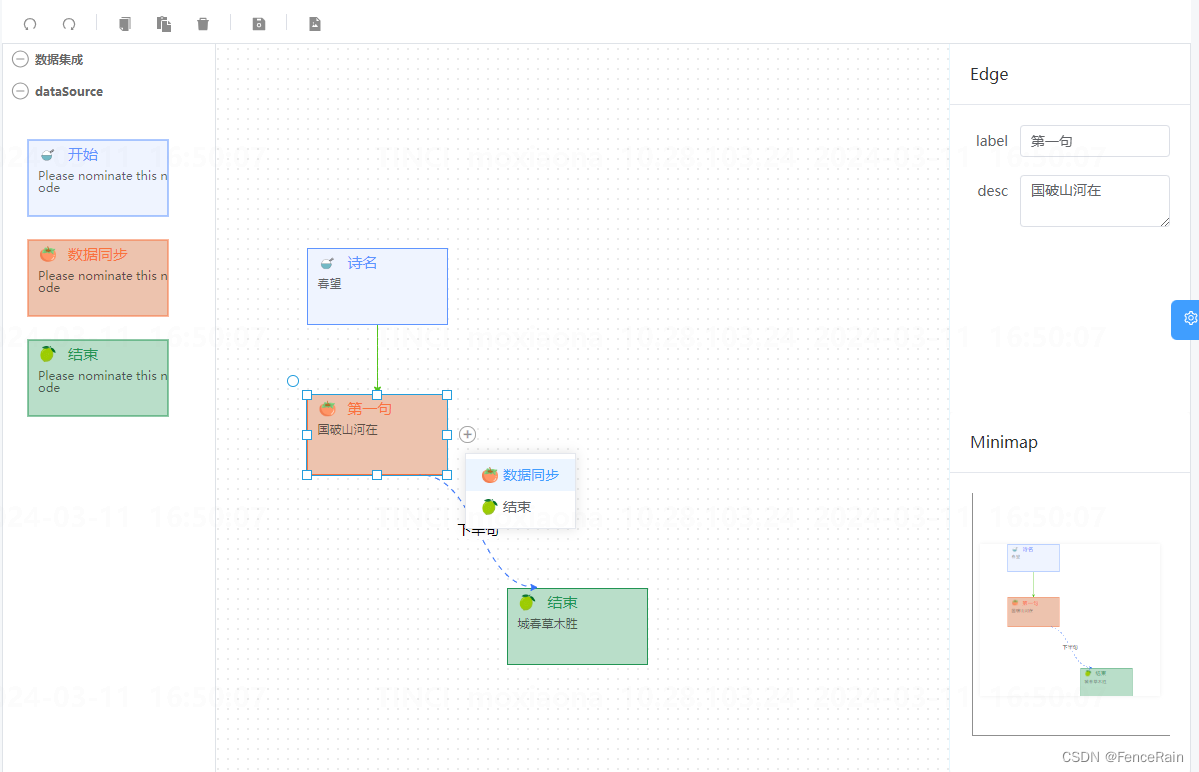
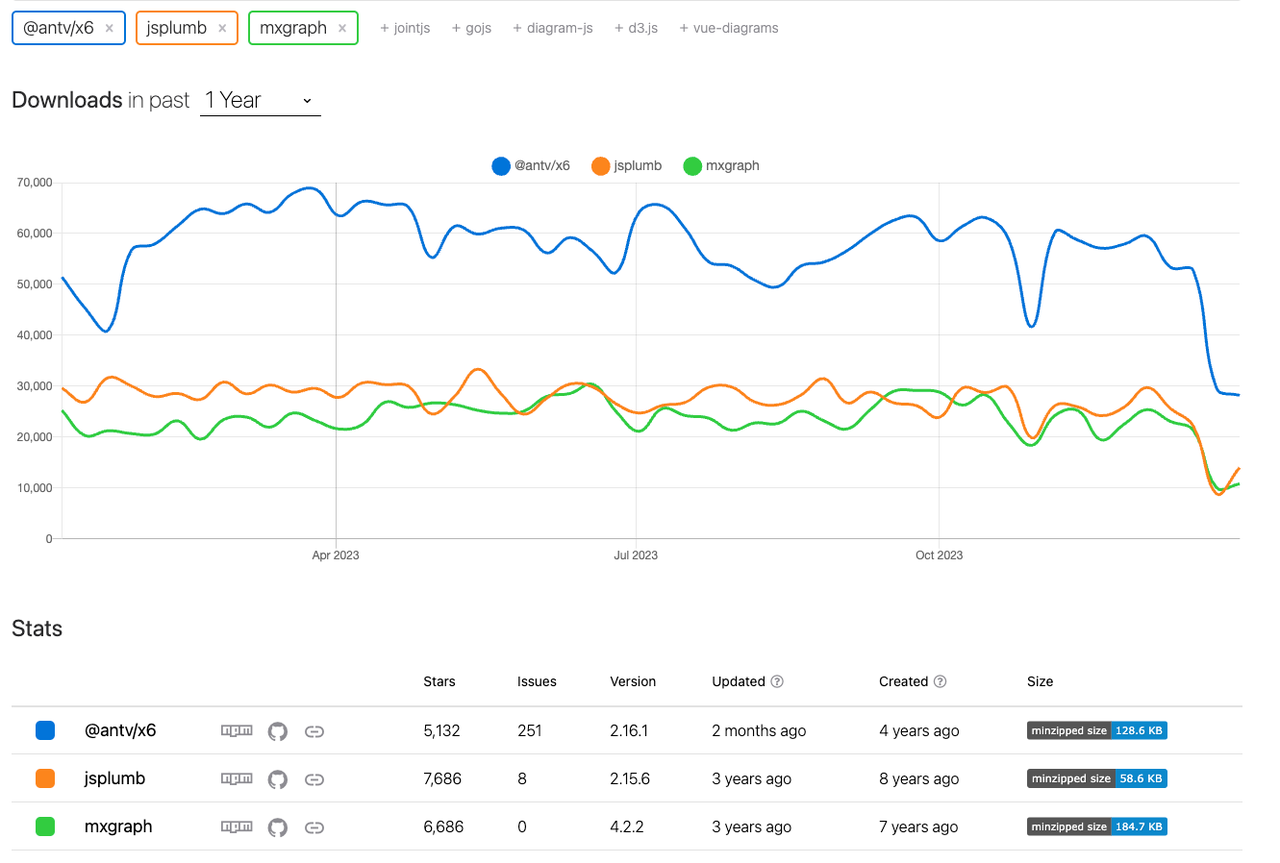
市面上的一些血缘链路图
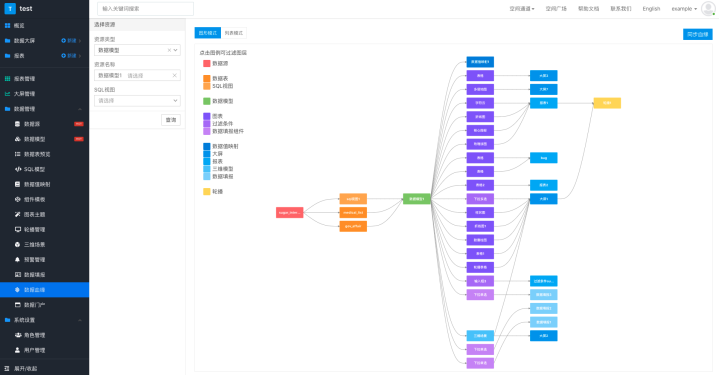
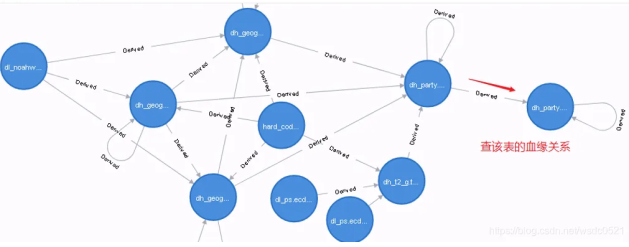
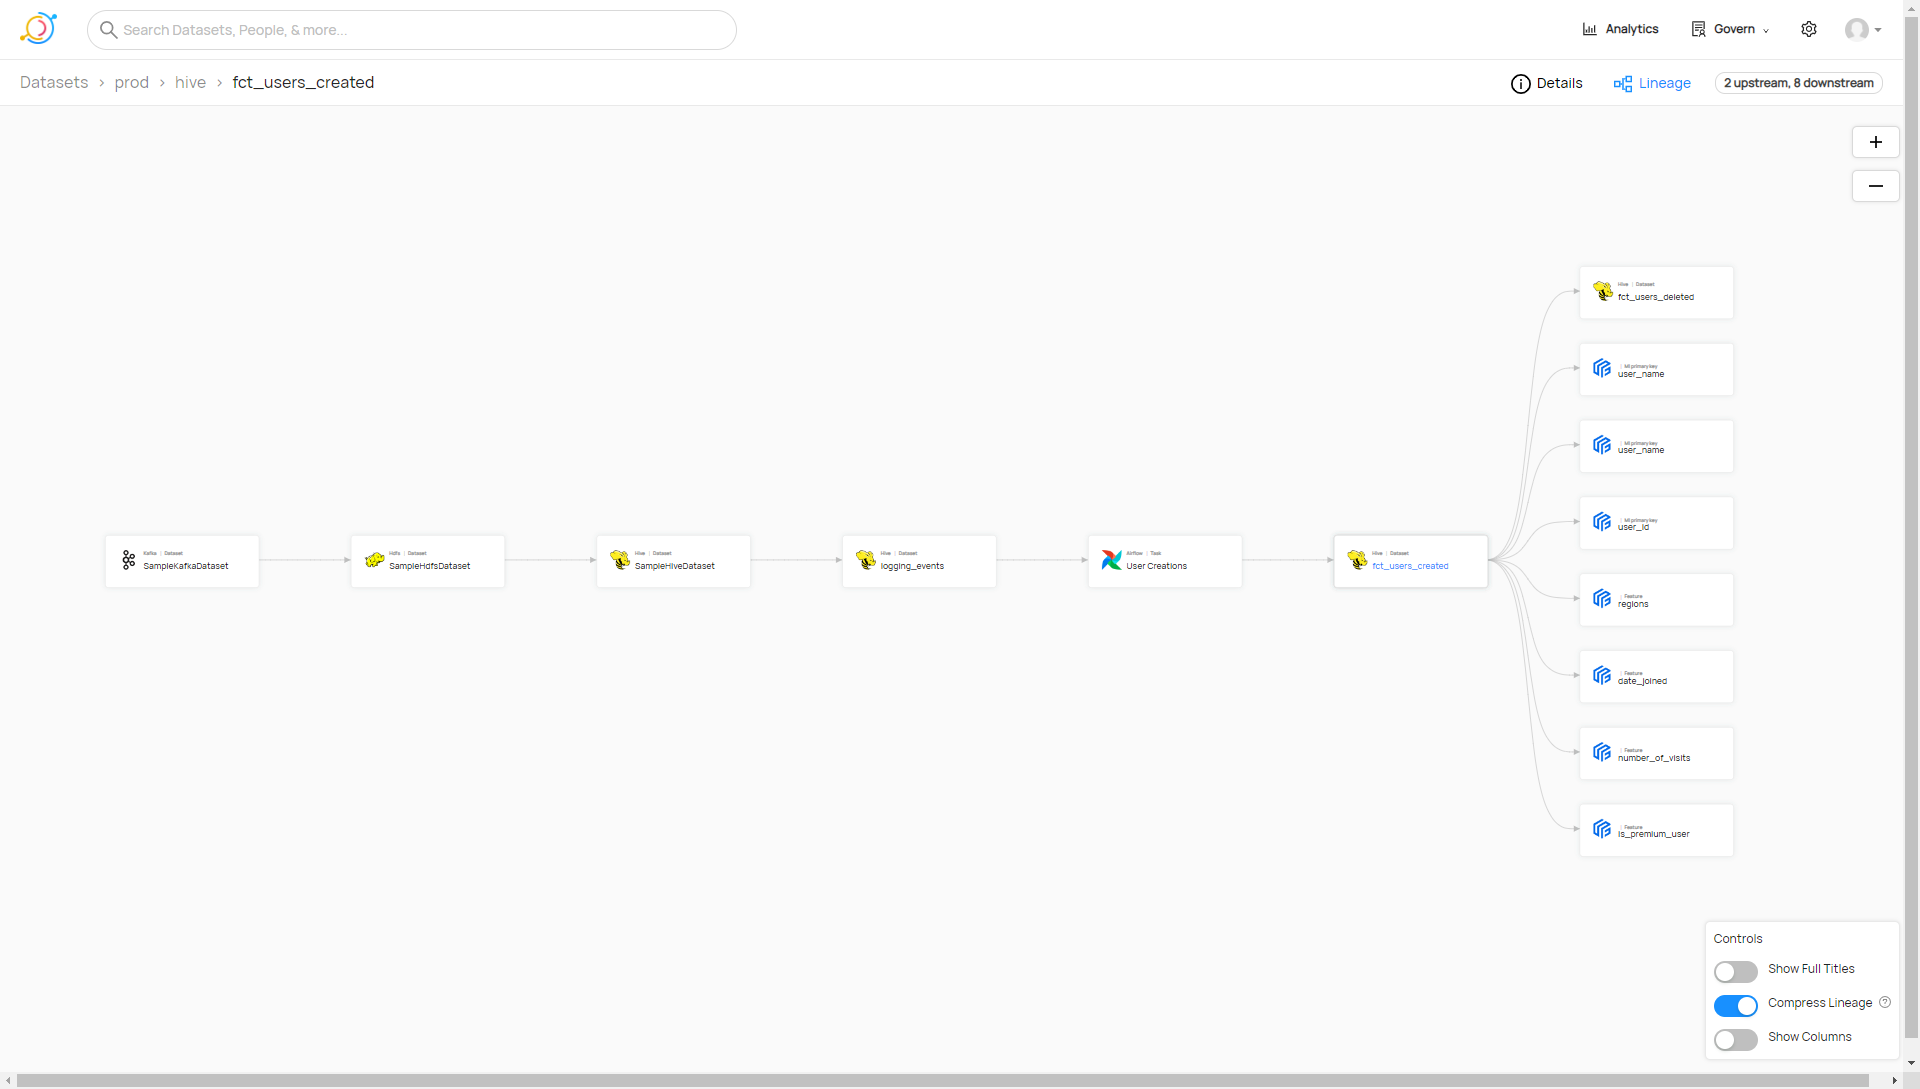
所有的血缘图都是节点和边组成,节点代表实体,表,api,应用,线代表任务或者作业。
有些血缘图数据流转没有从左到右的方向,而有些没有表现出分层的概念。
相比其他数据产品的血缘链路图,此次的改造,核心改良点有四个:
核心改良点:
- 数据链路中从左到右应包含,从数据源出发的表,到分层数据,未分层数据,接着到API,最后流转到APP。
- 具有分组的特点,以业务系统,数据分层,API, APP分组,美观,规整,辨识度高。
- 数据分层是可以配置顺序的,一旦链路中出现不符合顺序的数据流转,则使用红线表明,以示区分。
- 数据链路支持二个方向的展开,收起,增量加载,数据量大时有很好的信息处理能力。
四 开始前的尝试
分析需求,通读G6(阿里开源的一个简单、易用、完备的图可视化引擎)所有文档,清晰地描述所遇到的问题
使用dagre库,实现群组内多列,多行排版,不依赖canvas,输入节点与边,输出节点坐标及其他。
搜索G6提供的相关图遍历方法,找到节点上下游遍历方法
做多种尝试,做出最小demo解决问题,一次一小步,逐步完成。
- 节点,边 => dagre => graph
- 节点,边,群组 => dagre => graph
- 节点,边,动态群组 => dagre => graph
- 节点,边,动态群组,盒子模型 => dagre => graph
- 节点状态管理
- 节点左右展开收起
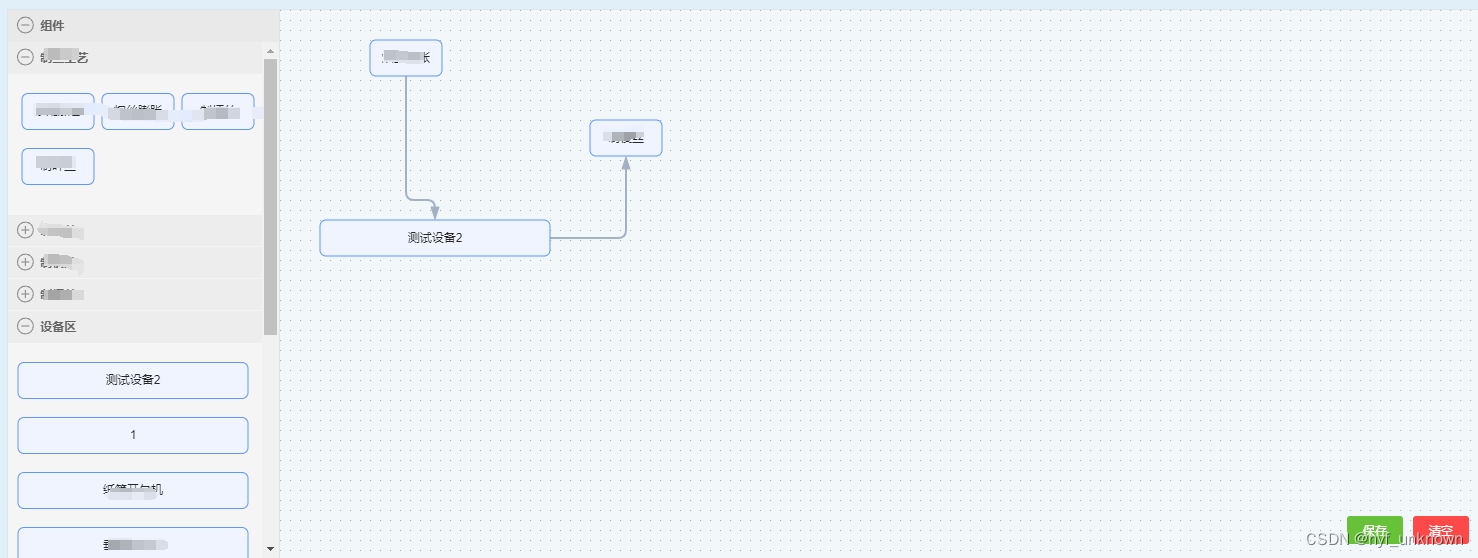
demo最终效果图:

在这张图上,每一个分组的顺序都是配置的,此外如果跨越了分组的线,将会显示红色,每个节点也有状态。
五 排版算法
1. 盒子模型

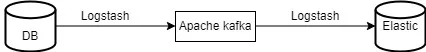
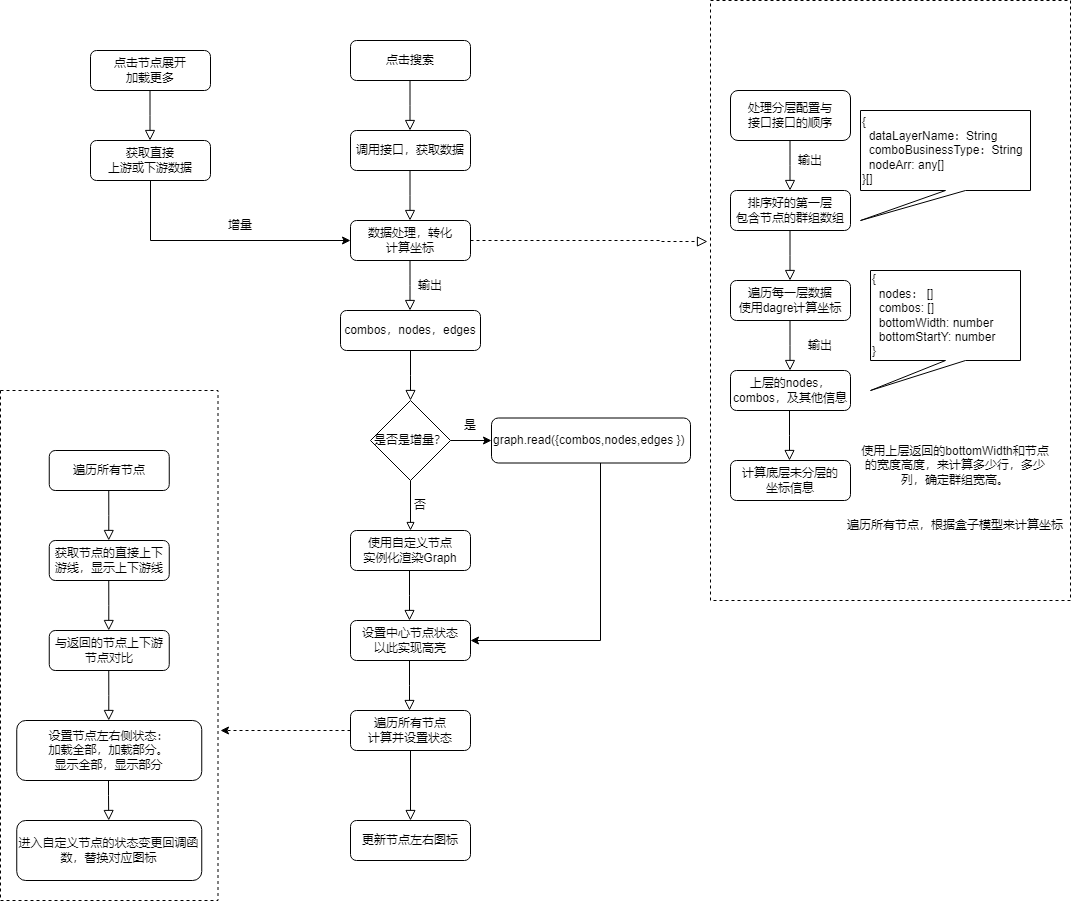
2. 数据处理流程
3. 核心方法
使用dagre库计算节点及群组坐标
// 计算业务系统,数据分层,api,app的数据坐标
export function computedLayerData(orderLayerArr: LayerItem[], edges: GraphEdge[]) {

  const combos: GraphCombo[] = []
  const nodes: GraphNode[] = []
  const res = {

    nodes,
    combos,
    bottomWidth: 0,
    bottomStartY: 0,
  }
  let MARGIN_LEFT = startNodeRight
  const len = orderLayerArr.length
  let layerItem, nodeItem

  for (let i = 0; i < len; i++) {

    const g = new dagre.graphlib.Graph()
    g.setGraph(DAG_CONFIG)
    g.setDefaultEdgeLabel(function () {

      return {
   }
    })
    layerItem = orderLayerArr[i]
    const {
    nodeArr, dataLayerName, comboBusinessType } = layerItem

    const nodeItemWidth =
      comboBusinessType === COMBO_BUSINESS_TYPE_BUSINESS ? businessNodeWidth : nodeWidth
    const nodeItemHeight =
      comboBusinessType === COMBO_BUSINESS_TYPE_BUSINESS ? businessNodeHeight : nodeHeight

    const nodeNum = nodeArr?.length || 0

    if (nodeNum === 0) {

      const comboItem: GraphCombo = {

        id: dataLayerName,
        label: dataLayerName,
        size: [singleColumnWidth, singleColumnDefaultHeight],
        x: singleColumnWidth / 2 + MARGIN_LEFT + comboPadding,
        y: singleColumnDefaultHeight / 2 + startNodeBottom + comboPadding,
      }
      res.combos.push(comboItem)
      MARGIN_LEFT = MARGIN_LEFT + comboItem.size[0] + comboMargin + 2 * comboPadding
      if (comboBusinessType === COMBO_BUSINESS_TYPE_TABLE) {

        res.bottomWidth = res.bottomWidth + singleColumnWidth + comboMargin + 2 * comboPadding
        const startY = singleColumnDefaultHeight + 2 * comboPadding + startNodeBottom
        res.bottomStartY = res.bottomStartY > startY ? res.bottomStartY : startY
      }
      continue
    }

    for (let q = 0; q < nodeNum; q++) {

      nodeItem = nodeArr[q]
      g.setNode(nodeItem.nodeId, {

        label: nodeItem.nodeId,
        width: nodeItemWidth,
        height: nodeItemHeight,
        originData: nodeItem,
      })
    }

    const tempNodes = g.nodes()
    for (let i = 0; i < edges.length; i++) {

      const {
    source, target } = edges[i]
      if (tempNodes.includes(source) && tempNodes.includes(target)) {

        g.setEdge(edges[i].source, edges[i].target)
      }
    }

    dagre.layout(g)

    let {
    width, height } = g.graph()

    g.nodes().forEach((v: any) => {

      const {
    x, y, originData } = g.node(v) || {
   }
      if (x && y) {

        let tableName = originData.tableName || originData.apiName || originData.name
        const datasourceNameAndDatabaseName = `${
     originData.datasourceName} | ${
     originData.databaseName}`
        const maxWidth =
          comboBusinessType === COMBO_BUSINESS_TYPE_BUSINESS
            ? nodeItemWidth - 12 * 2
            : nodeItemWidth - textMargin * 2

        tableName = fittingString(tableName, maxWidth, tableNameFontSize)
        res.nodes.push({

          id: v,
          type:
            comboBusinessType === COMBO_BUSINESS_TYPE_BUSINESS
              ? CustNodeTypeEnum.businessTableNode
              : CustNodeTypeEnum.datalinkNode,
          size: [nodeItemWidth, nodeItemHeight],
          x: x + MARGIN_LEFT + comboPadding,
          y: y + startNodeBottom + comboPadding,
          label: v,
          comboId: dataLayerName,
          upstreamNumber: originData.upstreamNumber,
          downstreamNumber: originData.downstreamNumber,
          tableName,
          databaseName: originData.databaseName,
          datasourceName: originData.datasourceName,
          datasourceNameAndDatabaseName: fittingString(
            datasourceNameAndDatabaseName,
            nodeItemWidth - 40,
            12
          ),
          originData,
        })
      }
    })

    height = height < singleColumnDefaultHeight ? singleColumnDefaultHeight : height
    width = width < singleColumnWidth ? singleColumnWidth : width
    const comboItem: GraphCombo = {

      id: dataLayerName,
      label: dataLayerName,
      size: [width, height],
      x: width / 2 + MARGIN_LEFT + comboPadding,
      y: height / 2 + startNodeBottom + comboPadding,
    }
    res.combos.push(comboItem)
    MARGIN_LEFT = MARGIN_LEFT + width + comboMargin + 2 * comboPadding

    if (comboBusinessType === COMBO_BUSINESS_TYPE_TABLE) {

      res.bottomWidth = res.bottomWidth + width + comboMargin + 2 * comboPadding
      const startY = height + 2 * comboPadding + startNodeBottom
      res.bottomStartY = res.bottomStartY > startY ? res.bottomStartY : startY
    }
  }

  if (len > 4) {

    res.bottomWidth = res.bottomWidth - comboMargin - 2 * comboPadding
  } else {

    res.bottomStartY =
      Math.max(res.combos[1].size[1], res.combos[2].size[1]) + 2 * comboPadding + startNodeBottom
    res.bottomWidth = singleColumnWidthWithPadding * 2 + comboMargin - 2 * comboPadding
  }
  return res
}
计算未分层的节点及群组坐标
// 计算未分层的数据
export function computedNoneLayerData(
  noneLayers: BloodNodeDTO[],
  bottomWidth: number,
  bottomStartY: number
) {

  const combo: GraphCombo = {

    id: '',
    label: '',
    size: [0, 0],
    x: 0,
    y: 0,
  }
  const nodes: GraphNode[] = []
  const res = {

    combo,
    nodes,
  }

  const cols = Math.floor(bottomWidth / (nodeWidth + nodeMarginRight))
  const rows = Math.ceil(noneLayers.length / cols)
  const comboHeight = rows * (nodeHeight + nodeMarginBottom)
  const comboX =
    bottomWidth / 2 + startNodeRight + singleColumnWidth + 3 * comboPadding + comboMargin
  const comboY = comboHeight / 2 + bottomStartY + comboPadding + comboMargin

  noneLayers.forEach((x, i) => {

    let nodeX = (i % cols) * (nodeWidth + nodeMarginRight)
    let nodeY = Math.ceil((i + 1) / cols) * (nodeHeight + nodeMarginBottom)
    nodeX = nodeX + startNodeRight + singleColumnWidth + 3 * comboPadding + comboMargin
    nodeY = nodeY + startNodeBottom + bottomStartY + comboPadding + comboMargin

    res.nodes.push({

      id: x.nodeId,
      type: CustNodeTypeEnum.datalinkNode,
      label: x.tableName,
      upstreamNumber: x.upstreamNumber,
      downstreamNumber: x.downstreamNumber,
      tableName: fittingString(x.tableName, nodeWidth - textMargin * 2, tableNameFontSize),
      originData: x,
      x: nodeX,
      y: nodeY,
      comboId: 'noneLayer',
      size: [nodeWidth, nodeHeight],
      databaseName: '',
      datasourceName: '',
    })
  })

  res.combo = {

    id: 'noneLayer',
    label: '未分层',
    size: [bottomWidth, comboHeight],
    x: comboX,
    y: comboY,
  }

  return res
}
计算节点状态
function computeNodeStatus(nodes, viewGraph) {

  if (viewGraph) {

    graph = viewGraph
  }
  if (!graph && !viewGraph) {

    console.warn('传参有误')
  }

  nodes.forEach(node => {

    const model = node.getModel()
    const upAllEdges = node.getInEdges()
    const downAllEdges = node.getOutEdges()
    const showUpEdges = upAllEdges.filter(x => x.isVisible())
    const showDownEdges = downAllEdges.filter(x => x.isVisible())

    const {
    upstreamNumber = 0, downstreamNumber = 0 } = model
    const states = node.getStates()

    const nodeStatusLoadLeft =
      upAllEdges.length < upstreamNumber ? NODE_STATUS_LOAD_LEFT_PART : NODE_STATUS_LOAD_LEFT_ALL
    if (!states.includes(`${
     NODE_STATUS_LOAD_LEFT}:${
     nodeStatusLoadLeft}`)) {

      node.setState(NODE_STATUS_LOAD_LEFT, nodeStatusLoadLeft)
    }

    const nodeStatusLoadRight =
      downAllEdges.length < downstreamNumber
        ? NODE_STATUS_LOAD_RIGHT_PART
        : NODE_STATUS_LOAD_RIGHT_ALL
    if (!states.includes(`${
     NODE_STATUS_LOAD_RIGHT}:${
     nodeStatusLoadRight}`)) {

      node.setState(NODE_STATUS_LOAD_RIGHT, nodeStatusLoadRight)
    }

    const nodeStatusLeft =
      showUpEdges.length === upstreamNumber ? NODE_STATUS_LEFT_EXPAND : NODE_STATUS_LEFT_COLLAPSE
    if (!states.includes(`${
     NODE_STATUS_LEFT}:${
     nodeStatusLeft}`)) {

      node.setState(NODE_STATUS_LEFT, nodeStatusLeft)
    }

    const nodeStatusRight =
      showDownEdges.length === downstreamNumber
        ? NODE_STATUS_RIGHT_EXPAND
        : NODE_STATUS_RIGHT_COLLAPSE
    if (!states.includes(`${
     NODE_STATUS_RIGHT}:${
     nodeStatusRight}`)) {

      node.setState(NODE_STATUS_RIGHT, nodeStatusRight)
    }
  })
}
六 细节处理
七 总结
数据链路图是数据开发产品中的一个核心特性,也是产品核心竞争力之一。对此感兴趣的可以多花一段时间做一个专题研究,也欢迎私下找我讨论。最后希望大家都能在滴普得到成长,做出自己的杰出的作品。要相信功夫不负有心人✌。