Detecting Congestion on a Remote Monitoring Platform
Remote monitoring platforms can monitor all the ports in a network simultaneously to provide network-wide single-pane-of-glass visibility. 远程监控平台可同时监控网络中的所有端口,以提供全网单一窗口可视性。
Refer to Chapter 3, the section on Detecting Congestion on a Remote Monitoring Platform, which explains using the following types of monitoring applications: 请参阅第 3 章 "在远程监控平台上检测拥塞 "一节,其中介绍了如何使用以下类型的监控应用程序:
![]() An application developed by the device manufacturer/vendor, such as Cisco Nexus Dashboard Fabric Controller (NDFC) and Nexus Dashboard Insights. 设备制造商/供应商开发的应用程序,如 Cisco Nexus Dashboard Fabric Controller (NDFC) 和 Nexus Dashboard Insights。
An application developed by the device manufacturer/vendor, such as Cisco Nexus Dashboard Fabric Controller (NDFC) and Nexus Dashboard Insights. 设备制造商/供应商开发的应用程序,如 Cisco Nexus Dashboard Fabric Controller (NDFC) 和 Nexus Dashboard Insights。
![]() A 3rd party or a custom-developed application, such as the MDS Traffic Monitoring (MTM) App. 第三方或定制开发的应用程序,如 MDS 流量监控 (MTM) 应用程序。
A 3rd party or a custom-developed application, such as the MDS Traffic Monitoring (MTM) App. 第三方或定制开发的应用程序,如 MDS 流量监控 (MTM) 应用程序。
This section provides a high-level overview of Cisco Nexus Dashboard Insights for detecting congestion in Ethernet networks. 本节简要介绍用于检测以太网拥塞的 Cisco Nexus Dashboard Insights。
To learn more about a custom-developed application for detecting and troubleshooting congestion in lossless Ethernet networks, refer to Chapter 9, which explains using the UCS Traffic Monitoring App (UTM). 要进一步了解定制开发的用于检测和排除无损以太网网络拥塞故障的应用程序,请参阅第 9 章,其中介绍了如何使用 UCS 流量监控应用程序 (UTM)。
Chapter 3 also explains The Pitfalls of Monitoring Network Traffic. Its sub-section on Average and Peak Utilization apply to lossless Ethernet networks as well. 第 3 章还介绍了 "监控网络流量的陷阱"。其中关于平均利用率和峰值利用率的小节也适用于无损以太网网络。
Congestion Detection using Cisco Nexus Dashboard Insights
Cisco Nexus Dashboard Insights receives metrics from switches and compute nodes at a low granularity of 1 second. It then analyzes the raw metrics using baselining, correlation, and forecasting algorithms to provide deep insights into traffic patterns. For congestion detection, Nexus Dashboard Insights detects data plane anomalies such as packet drops, latency, microbursts, and so on. It shows the end-to-end packet path of a flow with drops and drops reasons using an intuitive GUI. Cisco Nexus Dashboard Insights 以 1 秒的低粒度接收来自交换机和计算节点的指标。然后,它使用基线、相关性和预测算法分析原始指标,深入洞察流量模式。在拥塞检测方面,Nexus Dashboard Insights 可检测数据平面异常,如丢包、延迟、微爆发等。它使用直观的图形用户界面显示流量的端到端数据包路径,以及丢包和丢包的原因。
Figure 7-13 shows end-to-end path of a RoCEv2 flow, average network latency, and burst on Nexus Dashboard Insights. 图 7-13 显示了 RoCEv2 流量的端到端路径、平均网络延迟和 Nexus Dashboard Insights 上的突发。
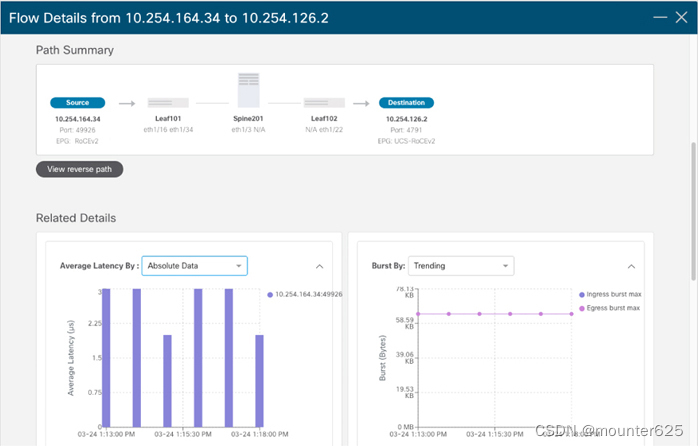
Figure 7-13 Monitoring RoCEv2 in Cisco Nexus Dashboard Insights
Metric Export Mechanisms
The mechanism for exporting metrics is a major consideration for a custom-developed application or a script. Most details that are explained in Chapter 3, the section on Metric Export Mechanisms apply to lossless Ethernet networks as well. 对于定制开发的应用程序或脚本而言,指标导出机制是一个重要的考虑因素。第 3 章 "指标导出机制 "一节中解释的大部分细节也适用于无损以太网网络。
Pay special attention to the Recommendations for metric exports as explained in Chapter 3. Using the command-line outputs and SNMP has been historically common but using the APIs has become the norm now. For low-granularity metric export at scale, streaming telemetry is the best option, and it is seeing rapid adoption. 请特别注意第 3 章介绍的指标输出建议。使用命令行输出和 SNMP 在历史上很常见,但现在使用 API 已成为常态。对于大规模的低粒度度量导出,流式遥测是最佳选择,而且正在被迅速采用。