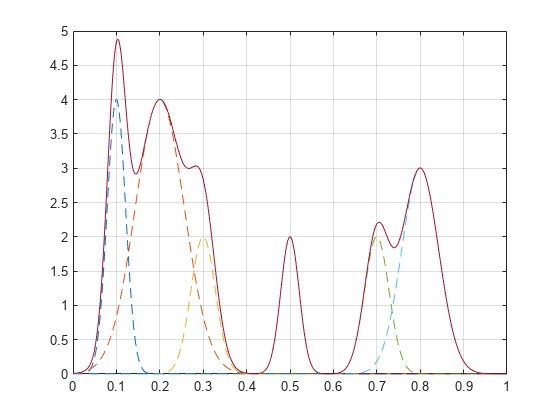
创建由钟形曲线之和组成的信号。指定每条曲线的位置、高度和宽度。
x = linspace(0,1,1000);

Pos = [1 2 3 5 7 8]/10;
Hgt = [4 4 2 2 2 3];
Wdt = [3 8 4 3 4 6]/100;

for n = 1:length(Pos)
    Gauss(n,:) =  Hgt(n)*exp(-((x - Pos(n))/Wdt(n)).^2);
end

PeakSig = sum(Gauss);
绘制各单条曲线及其总和。
plot(x,Gauss,'--',x,PeakSig)
grid
如图所示:
在相对高差的一半处测量波峰的宽度。
findpeaks(PeakSig,x,'Annotate','extents')如图所示:

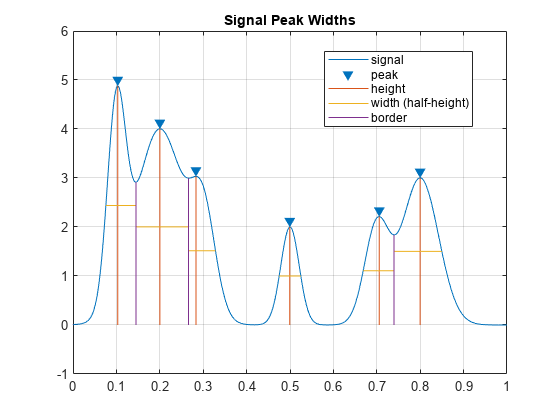
再次测量宽度,这次在半高处测量。
findpeaks(PeakSig,x,'Annotate','extents','WidthReference','halfheight')
title('Signal Peak Widths')
如图所示:


![Elasticsearch可视化平台Kibana [ES系列] - 第498篇](https://img-blog.csdnimg.cn/img_convert/b8f7c6544050b8296a17ed2c46283cea.png)