系列文章目录
前言
因为我们把圣诞树安装在暖气电池旁边,所以它很快就死了。所以我决定用 Matplotlib 绘制一棵圣诞树。你不需要为它遮阳避暑,它也不需要任何水。在阿瑞克斯星球,水的供应是有限的。地球上也是如此。
一、步骤
1.1
要在 matplotlib 中绘图,我们需要将其包含在内。
此外,我们还要为 3D 准备所有库。
import math
import matplotlib.pyplot as plt
from mpl_toolkits.mplot3d import Axes3D
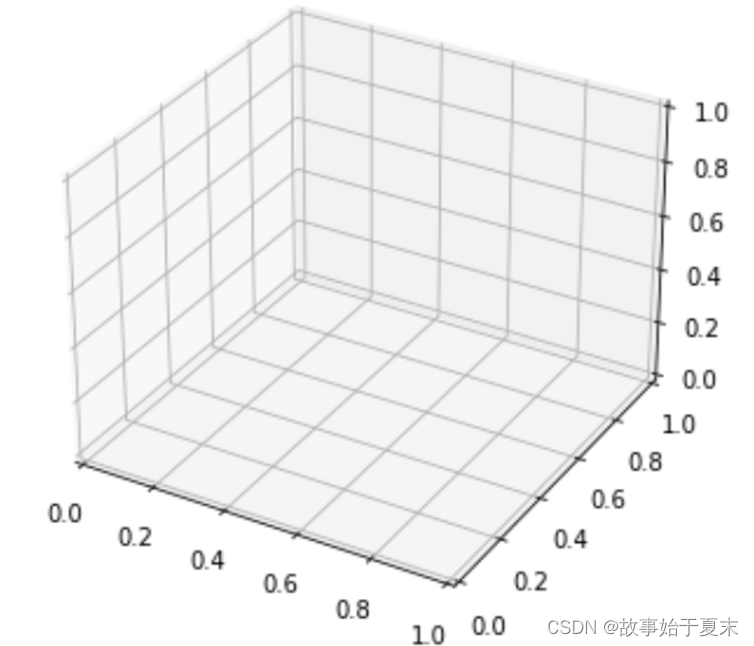
fig = plt.figure()
ax = fig.add_subplot(111, projection="3d")让我们先画一个 3D 圆,确保一切正常。
fig = plt.figure()
ax = fig.add_subplot(111, projection="3d")
k=300
Z = [10 for i in range(k)]
X = [math.cos(i/10) for i in range(k)]
Y = [math.sin(i/10) for i in range(k)]
ax.scatter(X,Y,Z, c="green", marker="^")
plt.show()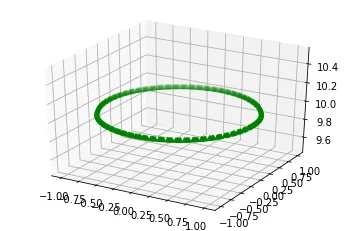
不错!这是非常标准的。我们现在只修复 Z 坐标。
现在,应用 Z 坐标使其 3D 化。
Z = [i for i in range(k)]
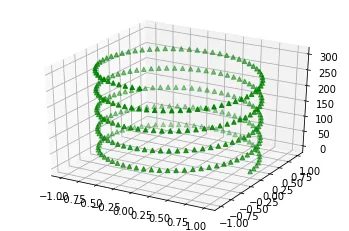
让我们在顶部缩小圆的半径。
Z = [i for i in range(k)]
X = [math.cos(i/5)*(k-i) for i in range(k)]
Y = [math.sin(i/5)*(k-i) for i in range(k)]
Matplotlib 总是倾向于贴合图形,只需在此处添加这些限制即可:
plt.xlim(-500,500)
plt.ylim(-500,500)

画一些红圈。它们的公式相同,但步长更大。我们还通过在 sin 和 cos 参数上加 2 来移动它,这样它们就不会与树本身相交。
k=300
Z = [i for i in range(k)]
X = [math.cos(i/5)*(k-i) for i in range(k)]
Y = [math.sin(i/5)*(k-i) for i in range(k)]
ax.scatter(X,Y,Z, c="green", marker="^")
k=300
step = 4
Z = [i for i in range(1,k,step)]
X = [math.cos(i/5+2)*(k-i+10) for i in range(1,k,step)]
Y = [math.sin(i/5+2)*(k-i+10) for i in range(1,k,step)]
ax.scatter(X,Y,Z, c="red", marker="o")
plt.xlim(-500,500)
plt.ylim(-500,500)
plt.show()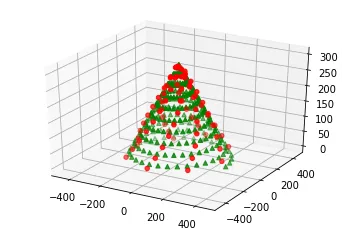
微调装饰
c = [(i/k,abs(0.5-i/k),i/k) for i in range(1,k,step)]
ax.scatter(X,Y,Z, c=c, marker="o",s=40)
要旋转树形图,我们需要为每一帧绘制树形图,并在 sin 和 cos 参数中添加一些常数。
我们为初始图形和每一帧复制代码。
import math
import matplotlib.pyplot as plt
from matplotlib import animation
from mpl_toolkits.mplot3d import Axes3D
fig = plt.figure(figsize=(8,8))
ax = fig.add_subplot(111, projection="3d")
def init():
    k=300
    Z = [i for i in range(k)]
    X = [math.cos(i/5)*(k-i) for i in range(k)]
    Y = [math.sin(i/5)*(k-i) for i in range(k)]
    ax.scatter(X,Y,Z, c="green", marker="^")
    step = 3
    c = [(i/k,abs(0.5-i/k),i/k) for i in range(1,k,step)]
    Z = [i for i in range(1,k,step)]
    X = [math.cos(i/5+2)*(k-i+10) for i in range(1,k,step)]
    Y = [math.sin(i/5+2)*(k-i+10) for i in range(1,k,step)]
    ax.scatter(X,Y,Z, c=c, marker="o",s=40)
    plt.xlim(-500,500)
    plt.ylim(-500,500)
    return fig,
def animate(f):
    fig.clear()
    ax = fig.add_subplot(111, projection="3d")
    k=300
    Z = [i for i in range(k)]
    X = [math.cos(i/5+f/10)*(k-i) for i in range(k)]
    Y = [math.sin(i/5+f/10)*(k-i) for i in range(k)]
    ax.scatter(X,Y,Z, c="green", marker="^")
    step = 3
    c = [(i/k,abs(0.5-i/k),i/k) for i in range(1,k,step)]
    Z = [i for i in range(1,k,step)]
    X = [math.cos(i/5+2+f/10)*(k-i+10) for i in range(1,k,step)]
    Y = [math.sin(i/5+2+f/10)*(k-i+10) for i in range(1,k,step)]
    ax.scatter(X,Y,Z, c=c, marker="o",s=40)
    plt.xlim(-500,500)
    plt.ylim(-500,500)
    return fig,
ani=animation.FuncAnimation(fig, animate, init_func=init,
                               frames=90, interval=50, blit=True)
ani.save("christmas_tree.mp4")
这就是结果:
不要忘记与您的朋友分享这棵树!
新年快乐
点击此处查看我的其他文章:timurbakibayev.medium.com
timurbakibayev.medium.com![]() http://timurbakibayev.medium.com/
http://timurbakibayev.medium.com/