一. JVM监控
- 通过
jmx_exporter启动端口来实现JVM的监控
Kubernetes Deployment Java 服务,修改
wget https://repo1.maven.org/maven2/io/prometheus/jmx/jmx_prometheus_javaagent/0.19.0/jmx_prometheus_javaagent-0.19.0.jar

# 编写配置文件,我是通过 hostPath 方式挂进 pod 中的
lowercaseOutputLabelNames: true
lowercaseOutputName: true
whitelistObjectNames: ["java.lang:type=OperatingSystem"]
rules:
 - pattern: 'java.lang<type=OperatingSystem><>((?!process_cpu_time)\w+):'
   name: os_$1
   type: GAUGE
   attrNameSnakeCase: true

# 加入启动参数,其他部分省略,只看增加的
    spec:
      containers:
      - command:
        - java
        - -javaagent:/home/prometheus/jmx/jmx_prometheus_javaagent-0.19.0.jar=9999:/home/prometheus/jmx/config.yml		# 加入启动参数,指定端口为9999,并指定配置文件

        volumeMounts:
        - mountPath: /home/prometheus/jmx
          name: jmx
      volumes:
      - hostPath:
          path: /home/prometheus/jmx
          type: ""
        name: jmx
Service 修改或增加
apiVersion: v1
kind: Service
metadata:
  annotations:					# Service加入2行注释
    prometheus.io/jvm: "true"
    prometheus.io/port: "9999"
  name: yff-uef-api
  namespace: yff
spec:
  ports:
  - name: http
    port: 8080
    protocol: TCP
    targetPort: 8080
  - name: jmx-metrices			# 并增加jmx所暴露的端口
    port: 9999
    protocol: TCP
    targetPort: 9999
  selector:
    name: yff-uef-api
    service/env: prod
  type: ClusterIP
Prometheus 增加 jvm 的配置
    - job_name: 'jvm'
      kubernetes_sd_configs:
      - role: endpoints
      relabel_configs:
      - source_labels: [__meta_kubernetes_service_annotation_prometheus_io_jvm]
        action: keep
        regex: true
      - source_labels: [__address__, __meta_kubernetes_service_annotation_prometheus_io_port]
        action: replace
        target_label: __address__
        regex: ([^:]+)(?::\d+)?;(\d+)
        replacement: $1:$2
      - source_labels: [__meta_kubernetes_service_name]
        action: replace
        regex: (.+)
        target_label: application
        replacement: $1
      - action: labelmap
        regex: __meta_kubernetes_service_label_(.+)
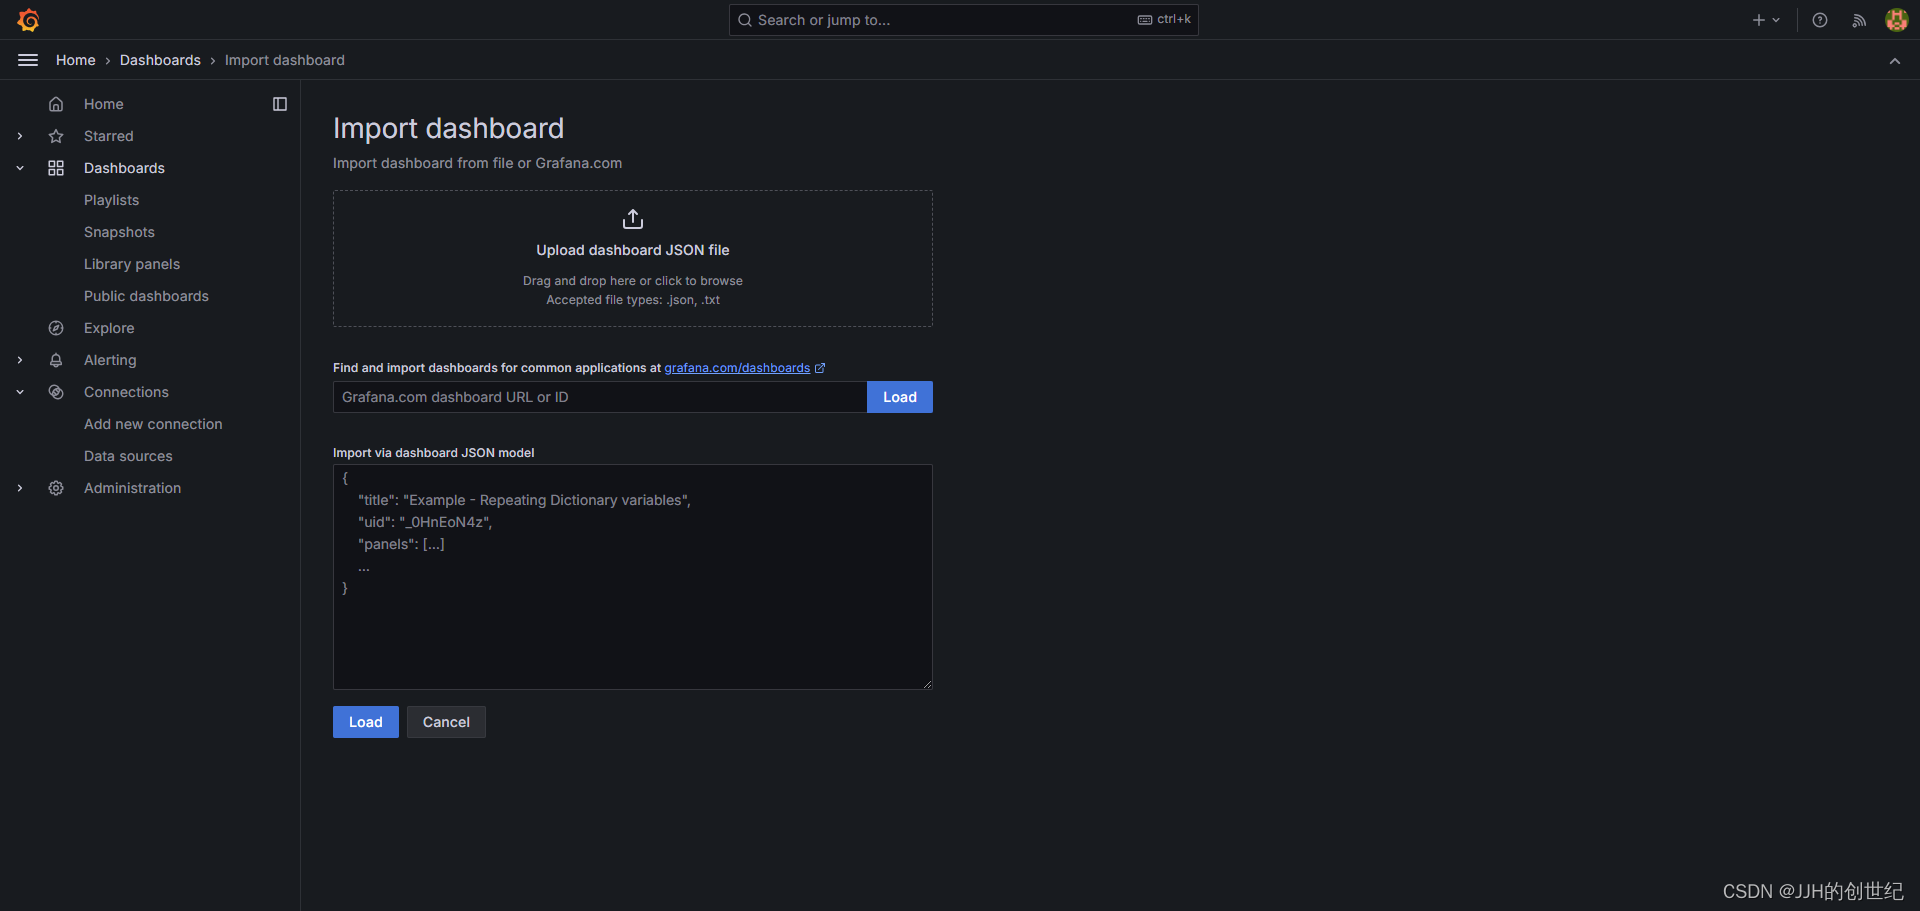
Grafana 增加面板
- 可以在官网寻找面板 JXM dashboard
- 如下是我的 dashboard json信息
{
"annotations": {
"list": [
{
"builtIn": 1,
"datasource": {
"type": "datasource",
"uid": "grafana"
},
"enable": true,
"hide": true,
"iconColor": "rgba(0, 211, 255, 1)",
"name": "Annotations & Alerts",
"type": "dashboard"
},
{
"datasource": {
"type": "prometheus",
"uid": "xpMiKxl4k"
},
"enable": true,
"expr": "resets(process_uptime_seconds{application=\"$application\", instance=\"$instance\"}[1m]) > 0",
"hide": false,
"iconColor": "rgba(255, 96, 96, 1)",
"name": "Restart Detection",
"showIn": 0,
"step": "1m",
"tagKeys": "restart-tag",
"textFormat": "uptime reset",
"titleFormat": "Restart"
}
]
},
"description": "Complete dashboard using metrics from prometheus JMX exporter, with drill down per job > instance",
"editable": true,
"fiscalYearStartMonth": 0,
"gnetId": 8563,
"graphTooltip": 0,
"id": 81,
"links": [],
"liveNow": false,
"panels": [
{
"datasource": {
"uid": "$datasource"
},
"fieldConfig": {
"defaults": {
"color": {
"mode": "thresholds"
},
"mappings": [
{
"options": {
"0": {
"text": "DOWN"
},
"1": {
"text": "UP"
}
},
"type": "value"
},
{
"options": {
"match": "null",
"result": {
"text": "DOWN"
}
},
"type": "special"
}
],
"thresholds": {
"mode": "absolute",
"steps": [
{
"color": "#d44a3a",
"value": null
},
{
"color": "#e24d42",
"value": 0
},
{
"color": "#299c46",
"value": 1
}
]
},
"unit": "none"
},
"overrides": []
},
"gridPos": {
"h": 4,
"w": 3,
"x": 3,
"y": 0
},
"hideTimeOverride": false,
"id": 21,
"links": [
{
"targetBlank": true,
"title": "Tomcat dashboard",
"url": "/d/chanjarster-tomcat-dashboard/tomcat-dashboard?$__url_time_range&$__all_variables"
}
],
"maxDataPoints": 100,
"options": {
"colorMode": "value",
"graphMode": "none",
"justifyMode": "auto",
"orientation": "horizontal",
"reduceOptions": {
"calcs": [
"lastNotNull"
],
"fields": "",
"values": false
},
"textMode": "auto"
},
"pluginVersion": "9.5.7",
"targets": [
{
"datasource": {
"uid": "$datasource"
},
"expr": "up{job=\"$job\",instance=\"$instance\"}",
"format": "time_series",
"instant": true,
"intervalFactor": 1,
"refId": "A"
}
],
"title": "Status",
"type": "stat"
},
{
"datasource": {
"uid": "$datasource"
},
"fieldConfig": {
"defaults": {
"color": {
"mode": "thresholds"
},
"decimals": 0,
"mappings": [
{
"options": {
"match": "null",
"result": {
"text": "N/A"
}
},
"type": "special"
}
],
"thresholds": {
"mode": "absolute",
"steps": [
{
"color": "green",
"value": null
},
{
"color": "red",
"value": 80
}
]
},
"unit": "s"
},
"overrides": []
},
"gridPos": {
"h": 4,
"w": 4,
"x": 6,
"y": 0
},
"id": 14,
"links": [],
"maxDataPoints": 100,
"options": {
"colorMode": "none",
"graphMode": "none",
"justifyMode": "auto",
"orientation": "horizontal",
"reduceOptions": {
"calcs": [
"lastNotNull"
],
"fields": "",
"values": false
},
"textMode": "auto"
},
"pluginVersion": "9.5.7",
"targets": [
{
"datasource": {
"uid": "$datasource"
},
"expr": "time() - process_start_time_seconds{job=\"$job\",instance=\"$instance\"}",
"format": "time_series",
"instant": true,
"intervalFactor": 1,
"refId": "A"
}
],
"title": "Uptime",
"type": "stat"
},
{
"datasource": {
"uid": "$datasource"
},
"fieldConfig": {
"defaults": {
"color": {
"mode": "thresholds"
},
"mappings": [
{
"options": {
"match": "null",
"result": {
"text": "N/A"
}
},
"type": "special"
}
],
"thresholds": {
"mode": "absolute",
"steps": [
{
"color": "#299c46",
"value": null
},
{
"color": "rgba(237, 129, 40, 0.89)",
"value": 35
},
{
"color": "#d44a3a",
"value": 50
}
]
},
"unit": "dateTimeAsIso"
},
"overrides": []
},
"gridPos": {
"h": 4,
"w": 4,
"x": 10,
"y": 0
},
"id": 15,
"interval": "",
"links": [],
"maxDataPoints": 100,
"options": {
"colorMode": "none",
"graphMode": "none",
"justifyMode": "auto",
"orientation": "horizontal",
"reduceOptions": {
"calcs": [
"lastNotNull"
],
"fields": "",
"values": false
},
"textMode": "auto"
},
"pluginVersion": "9.5.7",
"targets": [
{
"datasource": {
"uid": "$datasource"
},
"expr": "process_start_time_seconds{job=\"$job\",instance=\"$instance\"}*1000",
"format": "time_series",
"instant": true,
"intervalFactor": 1,
"refId": "A"
}
],
"title": "Start time",
"type": "stat"
},
{
"datasource": {
"uid": "$datasource"
},
"fieldConfig": {
"defaults": {
"color": {
"mode": "thresholds"
},
"decimals": 0,
"mappings": [
{
"options": {
"match": "null",
"result": {
"text": "N/A"
}
},
"type": "special"
}
],
"thresholds": {
"mode": "absolute",
"steps": [
{
"color": "green",
"value": null
},
{
"color": "red",
"value": 80
}
]
},
"unit": "none"
},
"overrides": []
},
"gridPos": {
"h": 4,
"w": 7,
"x": 14,
"y": 0
},
"id": 19,
"links": [],
"maxDataPoints": 100,
"options": {
"colorMode": "none",
"graphMode": "none",
"justifyMode": "auto",
"orientation": "horizontal",
"reduceOptions": {
"calcs": [
"lastNotNull"
],
"fields": "/^jdk$/",
"values": false
},
"textMode": "auto"
},
"pluginVersion": "9.5.7",
"targets": [
{
"datasource": {
"uid": "$datasource"
},
"expr": "label_join(jvm_info{job=\"$job\",instance=\"$instance\"}, \"jdk\", \", \", \"vendor\", \"runtime\", \"version\")",
"format": "table",
"instant": true,
"intervalFactor": 1,
"legendFormat": "",
"refId": "A"
}
],
"title": "JVM Version",
"type": "stat"
},
{
"datasource": {
"uid": "$datasource"
},
"fieldConfig": {
"defaults": {
"color": {
"mode": "thresholds"
},
"mappings": [
{
"options": {
"match": "null",
"result": {
"text": "N/A"
}
},
"type": "special"
}
],
"thresholds": {
"mode": "absolute",
"steps": [
{
"color": "green",
"value": null
},
{
"color": "red",
"value": 80
}
]
},
"unit": "none"
},
"overrides": []
},
"gridPos": {
"h": 4,
"w": 4,
"x": 6,
"y": 4
},
"id": 39,
"interval": "",
"links": [],
"maxDataPoints": 100,
"options": {
"colorMode": "none",
"graphMode": "none",
"justifyMode": "auto",
"orientation": "horizontal",
"reduceOptions": {
"calcs": [
"lastNotNull"
],
"fields": "",
"values": false
},
"textMode": "auto"
},
"pluginVersion": "9.5.7",
"targets": [
{
"datasource": {
"uid": "$datasource"
},
"expr": "os_available_processors{job=\"$job\",instance=\"$instance\"}",
"format": "time_series",
"instant": true,
"intervalFactor": 1,
"refId": "A"
}
],
"title": "Available CPUs",
"type": "stat"
},
{
"datasource": {
"uid": "$datasource"
},
"fieldConfig": {
"defaults": {
"color": {
"mode": "thresholds"
},
"mappings": [
{
"options": {
"match": "null",
"result": {
"text": "N/A"
}
},
"type": "special"
}
],
"thresholds": {
"mode": "absolute",
"steps": [
{
"color": "green",
"value": null
},
{
"color": "red",
"value": 80
}
]
},
"unit": "none"
},
"overrides": []
},
"gridPos": {
"h": 4,
"w": 4,
"x": 10,
"y": 4
},
"id": 23,
"links": [],
"maxDataPoints": 100,
"options": {
"colorMode": "none",
"graphMode": "none",
"justifyMode": "auto",
"orientation": "horizontal",
"reduceOptions": {
"calcs": [
"mean"
],
"fields": "",
"values": false
},
"textMode": "auto"
},
"pluginVersion": "9.5.7",
"targets": [
{
"datasource": {
"uid": "$datasource"
},
"expr": "os_system_load_average{job=\"$job\",instance=\"$instance\"}",
"format": "time_series",
"instant": true,
"intervalFactor": 1,
"refId": "A"
}
],
"title": "System load average",
"type": "stat"
},
{
"datasource": {
"uid": "$datasource"
},
"fieldConfig": {
"defaults": {
"color": {
"mode": "thresholds"
},
"mappings": [
{
"options": {
"match": "null",
"result": {
"text": "N/A"
}
},
"type": "special"
}
],
"thresholds": {
"mode": "absolute",
"steps": [
{
"color": "green",
"value": null
},
{
"color": "red",
"value": 80
}
]
},
"unit": "none"
},
"overrides": []
},
"gridPos": {
"h": 4,
"w": 4,
"x": 14,
"y": 4
},
"id": 38,
"links": [],
"maxDataPoints": 100,
"options": {
"colorMode": "none",
"graphMode": "none",
"justifyMode": "auto",
"orientation": "horizontal",
"reduceOptions": {
"calcs": [
"mean"
],
"fields": "",
"values": false
},
"textMode": "auto"
},
"pluginVersion": "9.5.7",
"targets": [
{
"datasource": {
"uid": "$datasource"
},
"expr": "os_open_file_descriptor_count{job=\"$job\",instance=\"$instance\"}",
"format": "time_series",
"instant": true,
"intervalFactor": 1,
"refId": "A"
}
],
"title": "Open file descriptors",
"type": "stat"
},
{
"aliasColors": {
},
"bars": false,
"dashLength": 10,
"dashes": false,
"datasource": {
"uid": "$datasource"
},
"decimals": 1,
"fill": 1,
"fillGradient": 0,
"gridPos": {
"h": 9,
"w": 24,
"x": 0,
"y": 8
},
"hiddenSeries": false,
"id": 29,
"legend": {
"alignAsTable": true,
"avg": false,
"current": true,
"max": true,
"min": false,
"show": true,
"total": false,
"values": true
},
"lines": true,
"linewidth": 1,
"links": [],
"nullPointMode": "null",
"options": {
"alertThreshold": true
},
"percentage": false,
"pluginVersion": "9.5.7",
"pointradius": 5,
"points": false,
"renderer": "flot",
"seriesOverrides": [],
"spaceLength": 10,
"stack": false,
"steppedLine": false,
"targets": [
{
"datasource": {
"uid": "$datasource"
},
"expr": "os_system_cpu_load{job=\"$job\",instance=\"$instance\"}",
"format": "time_series",
"intervalFactor": 1,
"legendFormat": "System",
"refId": "B"
},
{
"datasource": {
"uid": "$datasource"
},
"expr": "os_process_cpu_load{job=\"$job\",instance=\"$instance\"}",
"format": "time_series",
"intervalFactor": 1,
"legendFormat": "JVM",
"refId": "A"
}
],
"thresholds": [],
"timeRegions": [],
"title": "CPU load",
"tooltip": {
"shared": true,
"sort": 0,
"value_type": "individual"
},
"type": "graph",
"xaxis": {
"mode": "time",
"show": true,
"values": []
},
"yaxes": [
{
"decimals": 1,
"format": "percentunit",
"logBase": 1,
"show": true
},
{
"format": "short",
"logBase": 1,
"show": false
}
],
"yaxis": {
"align": false
}
},
{
"aliasColors": {
},
"bars": false,
"dashLength": 10,
"dashes": false,
"datasource": {
"uid": "$datasource"
},
"fill": 1,
"fillGradient": 0,
"gridPos": {
"h": 9,
"w": 12,
"x": 0,
"y": 17
},
"hiddenSeries": false,
"id": 8,
"legend": {
"alignAsTable": true,
"avg": true,
"current": true,
"max": true,
"min": true,
"rightSide": false,
"show": true,
"sortDesc": true,
"total": false,
"values": true
},
"lines": true,
"linewidth": 1,
"links": [],
"maxPerRow": 2,
"nullPointMode": "null",
"options": {
"alertThreshold": true
},
"percentage": false,
"pluginVersion": "9.5.7",
"pointradius": 5,
"points": false,
"renderer": "flot",
"repeat": "memarea",
"repeatDirection": "h",
"seriesOverrides": [
{
"alias": "Usage %",
"bars": true,
"color": "#6d1f62",
"legend": false,
"lines": false,
"yaxis": 2,
"zindex": -1
}
],
"spaceLength": 10,
"stack": false,
"steppedLine": false,
"targets": [
{
"datasource": {
"uid": "$datasource"
},
"expr": "jvm_memory_bytes_used{area=\"$memarea\",job=\"$job\",instance=\"$instance\"}",
"format": "time_series",
"intervalFactor": 1,
"legendFormat": "Used",
"refId": "A"
},
{
"datasource": {
"uid": "$datasource"
},
"expr": " jvm_memory_bytes_max{area=\"$memarea\",job=\"$job\",instance=\"$instance\"}",
"format": "time_series",
"intervalFactor": 1,
"legendFormat": "Max",
"refId": "B"
},
{
"datasource": {
"uid": "$datasource"
},
"expr": "jvm_memory_bytes_used{area=\"$memarea\",job=\"$job\",instance=\"$instance\"} / jvm_memory_bytes_max >= 0",
"format": "time_series",
"intervalFactor": 1,
"legendFormat": "Usage %",
"refId": "C"
}
],
"thresholds": [],
"timeRegions": [],
"title": "Memory area [$memarea]",
"tooltip": {
"shared": true,
"sort": 0,
"value_type": "individual"
},
"type": "graph",
"xaxis": {
"mode": "time",
"show": true,
"values": []
},
"yaxes": [
{
"format": "bytes",
"logBase": 1,
"show": true
},
{
"format": "percentunit",
"label": "",
"logBase": 1,
"max": "1",
"min": "0",
"show": true
}
],
"yaxis": {
"align": false
}
},
{
"aliasColors": {
},
"bars": false,
"dashLength": 10,
"dashes": false,
"datasource": {
"uid": "$datasource"
},
"fill": 1,
"fillGradient": 0,
"gridPos": {
"h": 9,
"w": 12,
"x": 0,
"y": 26
},
"hiddenSeries": false,
"id": 2,
"legend": {
"alignAsTable": true,
"avg": true,
"current": true,
"max": true,
"min": true,
"rightSide": false,
"show": true,
"sort": "current",
"sortDesc": true,
"total": false,
"values": true
},
"lines": true,
"linewidth": 1,
"links": [],
"maxPerRow": 2,
"nullPointMode": "null",
"options": {
"alertThreshold": true
},
"percentage": false,
"pluginVersion": "9.5.7",
"pointradius": 5,
"points": false,
"renderer": "flot",
"repeat": "mempool",
"repeatDirection": "h",
"seriesOverrides": [],
"spaceLength": 10,
"stack": false,
"steppedLine": false,
"targets": [
{
"datasource": {
"uid": "$datasource"
},
"expr": "jvm_memory_pool_bytes_max{pool=\"$mempool\",job=\"$job\",instance=\"$instance\"}",
"format": "time_series",
"interval": "",
"intervalFactor": 1,
"legendFormat": "Max",
"metric": "jvm_memory_bytes_used",
"refId": "B",
"step": 5
},
{
"datasource": {
"uid": "$datasource"
},
"expr": "jvm_memory_pool_bytes_used{pool=\"$mempool\",job=\"$job\",instance=\"$instance\"}",
"format": "time_series",
"interval": "",
"intervalFactor": 1,
"legendFormat": "Used",
"metric": "jvm_memory_bytes_used",
"refId": "A",
"step": 5
},
{
"datasource": {
"uid": "$datasource"
},
"expr": "jvm_memory_pool_bytes_committed{pool=\"$mempool\",job=\"$job\",instance=\"$instance\"}",
"format": "time_series",
"interval": "",
"intervalFactor": 1,
"legendFormat": "Committed",
"metric": "jvm_memory_bytes_used",
"refId": "C",
"step": 5
}
],
"thresholds": [],
"timeRegions": [],
"title": "Memory pool [$mempool]",
"tooltip": {
"shared": true,
"sort": 0,
"value_type": "individual"
},
"type": "graph",
"xaxis": {
"mode": "time",
"show": true,
"values": []
},
"yaxes": [
{
"format": "bytes",
"logBase": 1,
"show": true
},
{
"format": "short",
"logBase": 1,
"show": true
}
],
"yaxis": {
"align": false
}
},
{
"aliasColors": {
},
"bars": false,
"dashLength": 10,
"dashes": false,
"datasource": {
"uid": "$datasource"
},
"decimals": 0,
"fill": 1,
"fillGradient": 0,
"gridPos": {
"h": 9,
"w": 12,
"x": 0,
"y": 53
},
"hiddenSeries": false,
"id": 6,
"legend": {
"alignAsTable": true,
"avg": false,
"current": true,
"max": true,
"min": true,
"show": true,
"total": false,
"values": true
},
"lines": true,
"linewidth": 1,
"links": [],
"nullPointMode": "null",
"options": {
"alertThreshold": true
},
"percentage": false,
"pluginVersion": "9.5.7",
"pointradius": 5,
"points": false,
"renderer": "flot",
"seriesOverrides": [],
"spaceLength": 10,
"stack": false,
"steppedLine": false,
"targets": [
{
"datasource": {
"uid": "$datasource"
},
"expr": "increase(jvm_gc_collection_seconds_count{job=\"$job\",instance=~\"$instance\"}[$__interval])",
"format": "time_series",
"interval": "60s",
"intervalFactor": 1,
"legendFormat": "{
{gc}}",
"metric": "",
"refId": "A",
"step": 10
}
],
"thresholds": [],
"timeRegions": [],
"title": "GC count increase",
"tooltip": {
"shared": true,
"sort": 0,
"value_type": "individual"
},
"type": "graph",
"xaxis": {
"mode": "time",
"show": true,
"values": []
},
"yaxes": [
{
"decimals": 0,
"format": "short",
"logBase": 1,
"show": true
},
{
"format": "short",
"logBase": 1,
"show": false
}
],
"yaxis": {
"align": false
}
},
{
"aliasColors": {
},
"bars": false,
"dashLength": 10,
"dashes": false,
"datasource": {
"uid": "$datasource"
},
"decimals": 0,
"fill": 1,
"fillGradient": 0,
"gridPos": {
"h": 9,
"w": 12,
"x": 12,
"y": 53
},
"hiddenSeries": false,
"id": 5,
"legend": {
"alignAsTable": true,
"avg": false,
"current": true,
"max": true,
"min": true,
"rightSide": false,
"show": true,
"total": false,
"values": true
},
"lines": true,
"linewidth": 1,
"links": [],
"nullPointMode": "null",
"options": {
"alertThreshold": true
},
"percentage": false,
"pluginVersion": "9.5.7",
"pointradius": 5,
"points": false,
"renderer": "flot",
"seriesOverrides": [],
"spaceLength": 10,
"stack": false,
"steppedLine": false,
"targets": [
{
"datasource": {
"uid": "$datasource"
},
"expr": "increase(jvm_gc_collection_seconds_sum{job=\"$job\",instance=~\"$instance\"}[$__interval])",
"format": "time_series",
"interval": "60s",
"intervalFactor": 1,
"legendFormat": "{
{gc}}",
"metric": "jvm_gc_collection_seconds_sum",
"refId": "A",
"step": 10
}
],
"thresholds": [],
"timeRegions": [],
"title": "GC time",
"tooltip": {
"shared": true,
"sort": 0,
"value_type": "individual"
},
"type": "graph",
"xaxis": {
"mode": "time",
"show": true,
"values": []
},
"yaxes": [
{
"format": "s",
"logBase": 1,
"show": true
},
{
"format": "short",
"logBase": 1,
"show": false
}
],
"yaxis": {
"align": false
}
},
{
"aliasColors": {
},
"bars": false,
"dashLength": 10,
"dashes": false,
"datasource": {
"uid": "$datasource"
},
"decimals": 0,
"fill": 1,
"fillGradient": 0,
"gridPos": {
"h": 9,
"w": 12,
"x": 0,
"y": 62
},
"hiddenSeries": false,
"id": 3,
"legend": {
"alignAsTable": true,
"avg": false,
"current": true,
"hideZero": true,
"max": true,
"min": false,
"rightSide": false,
"show": true,
"total": false,
"values": true
},
"lines": true,
"linewidth": 1,
"links": [],
"nullPointMode": "null",
"options": {
"alertThreshold": true
},
"percentage": false,
"pluginVersion": "9.5.7",
"pointradius": 5,
"points": false,
"renderer": "flot",
"seriesOverrides": [],
"spaceLength": 10,
"stack": false,
"steppedLine": false,
"targets": [
{
"datasource": {
"uid": "$datasource"
},
"expr": "jvm_threads_current{job=\"$job\",instance=\"$instance\"}",
"format": "time_series",
"intervalFactor": 5,
"legendFormat": "JVM current threads",
"metric": "jvm_threads_current",
"refId": "A",
"step": 10
},
{
"datasource": {
"uid": "$datasource"
},
"expr": "jvm_threads_daemon{job=\"$job\",instance=\"$instance\"}",
"format": "time_series",
"intervalFactor": 5,
"legendFormat": "JVM daemon threads",
"metric": "jvm_threads_daemon",
"refId": "B",
"step": 10
},
{
"datasource": {
"uid": "$datasource"
},
"expr": "jvm_threads_deadlocked{job=\"$job\",instance=\"$instance\"}",
"format": "time_series",
"intervalFactor": 1,
"legendFormat": "JVM deadlocked threads",
"refId": "C"
}
],
"thresholds": [],
"timeRegions": [],
"title": "Threads used",
"tooltip": {
"shared": true,
"sort": 0,
"value_type": "individual"
},
"type": "graph",
"xaxis": {
"mode": "time",
"show": true,
"values": []
},
"yaxes": [
{
"decimals": 0,
"format": "short",
"logBase": 1,
"show": true
},
{
"format": "short",
"logBase": 1,
"show": false
}
],
"yaxis": {
"align": false
}
},
{
"aliasColors": {
},
"bars": false,
"dashLength": 10,
"dashes": false,
"datasource": {
"type": "prometheus",
"uid": "$datasource"
},
"fill": 1,
"fillGradient": 0,
"gridPos": {
"h": 9,
"w": 12,
"x": 12,
"y": 62
},
"hiddenSeries": false,
"id": 4,
"legend": {
"alignAsTable": true,
"avg": false,
"current": true,
"max": true,
"min": true,
"show": true,
"total": false,
"values": true
},
"lines": true,
"linewidth": 1,
"links": [],
"nullPointMode": "null",
"options": {
"alertThreshold": true
},
"percentage": false,
"pluginVersion": "9.5.7",
"pointradius": 5,
"points": false,
"renderer": "flot",
"seriesOverrides": [],
"spaceLength": 10,
"stack": false,
"steppedLine": false,
"targets": [
{
"datasource": {
"uid": "$datasource"
},
"editorMode": "code",
"expr": "jvm_classes_loaded_total{job=\"$job\", instance=\"$instance\"}",
"format": "time_series",
"interval": "",
"intervalFactor": 5,
"legendFormat": "loaded",
"metric": "jvm_classes_loaded",
"range": true,
"refId": "A",
"step": 10
}
],
"thresholds": [],
"timeRegions": [],
"title": "Class loading",
"tooltip": {
"shared": true,
"sort": 0,
"value_type": "individual"
},
"type": "graph",
"xaxis": {
"mode": "time",
"show": true,
"values": []
},
"yaxes": [
{
"$$hashKey": "object:412",
"decimals": 0,
"format": "short",
"label": "",
"logBase": 1,
"show": true
},
{
"$$hashKey": "object:413",
"format": "short",
"logBase": 1,
"show": false
}
],
"yaxis": {
"align": false
}
},
{
"aliasColors": {
},
"bars": false,
"dashLength": 10,
"dashes": false,
"datasource": {
"type": "prometheus",
"uid": "$datasource"
},
"fill": 1,
"fillGradient": 0,
"gridPos": {
"h": 10,
"w": 24,
"x": 0,
"y": 71
},
"hiddenSeries": false,
"id": 44,
"legend": {
"alignAsTable": true,
"avg": false,
"current": true,
"max": true,
"min": true,
"show": true,
"total": false,
"values": true
},
"lines": true,
"linewidth": 1,
"links": [],
"nullPointMode": "null",
"options": {
"alertThreshold": true
},
"percentage": false,
"pluginVersion": "9.5.7",
"pointradius": 5,
"points": false,
"renderer": "flot",
"seriesOverrides": [],
"spaceLength": 10,
"stack": false,
"steppedLine": false,
"targets": [
{
"datasource": {
"uid": "$datasource"
},
"editorMode": "code",
"expr": "os_total_physical_memory_size{job=\"$job\",instance=\"$instance\"}",
"format": "time_series",
"intervalFactor": 1,
"legendFormat": "Total physical memory",
"range": true,
"refId": "A"
},
{
"datasource": {
"uid": "$datasource"
},
"editorMode": "code",
"expr": "os_committed_virtual_memory_size{job=\"$job\",instance=\"$instance\"}",
"format": "time_series",
"intervalFactor": 1,
"legendFormat": "Committed virtual memory",
"range": true,
"refId": "B"
},
{
"datasource": {
"uid": "$datasource"
},
"editorMode": "code",
"expr": "os_free_physical_memory_size{job=\"$job\",instance=\"$instance\"}",
"format": "time_series",
"intervalFactor": 1,
"legendFormat": "Free physical memory",
"range": true,
"refId": "C"
}
],
"thresholds": [],
"timeRegions": [],
"title": "Physical memory",
"tooltip": {
"shared": true,
"sort": 0,
"value_type": "individual"
},
"type": "graph",
"xaxis": {
"mode": "time",
"show": true,
"values": []
},
"yaxes": [
{
"$$hashKey": "object:486",
"format": "decbytes",
"logBase": 1,
"show": true
},
{
"$$hashKey": "object:487",
"format": "short",
"logBase": 1,
"show": true
}
],
"yaxis": {
"align": false
}
}
],
"refresh": "5s",
"schemaVersion": 38,
"style": "dark",
"tags": [
"JVM",
"Kubernetes"
],
"templating": {
"list": [
{
"current": {
"selected": false,
"text": "Prometheus",
"value": "Prometheus"
},
"hide": 0,
"includeAll": false,
"multi": false,
"name": "datasource",
"options": [],
"query": "prometheus",
"queryValue": "",
"refresh": 1,
"regex": "",
"skipUrlSync": false,
"type": "datasource"
},
{
"current": {
"selected": true,
"text": "jvm",
"value": "jvm"
},
"hide": 0,
"label": "job",
"name": "job",
"options": [
{
"selected": true,
"text": "jvm",
"value": "jvm"
}
],
"query": "jvm",
"skipUrlSync": false,
"type": "textbox"
},
{
"current": {
"selected": false,
"text": "digitalclinic-queueflow-api-jmx",
"value": "digitalclinic-queueflow-api-jmx"
},
"datasource": {
"type": "prometheus",
"uid": "xpMiKxl4k"
},
"definition": "label_values(jvm_info{job=\"$job\"},application)",
"hide": 0,
"includeAll": false,
"label": "Application",
"multi": false,
"name": "application",
"options": [],
"query": {
"query": "label_values(jvm_info{job=\"$job\"},application)",
"refId": "StandardVariableQuery"
},
"refresh": 2,
"regex": "",
"skipUrlSync": false,
"sort": 0,
"tagValuesQuery": "",
"tagsQuery": "",
"type": "query",
"useTags": false
},
{
"allValue": ".*",
"current": {
"selected": false,
"text": "172.17.204.47:9999",
"value": "172.17.204.47:9999"
},
"datasource": {
"type": "prometheus",
"uid": "xpMiKxl4k"
},
"definition": "label_values(jvm_info{application=\"$application\"},instance)",
"hide": 0,
"includeAll": false,
"label": "instance",
"multi": false,
"name": "instance",
"options": [],
"query": {
"query": "label_values(jvm_info{application=\"$application\"},instance)",
"refId": "StandardVariableQuery"
},
"refresh": 1,
"regex": "",
"skipUrlSync": false,
"sort": 0,
"tagValuesQuery": "",
"tagsQuery": "",
"type": "query",
"useTags": false
},
{
"current": {
"selected": true,
"text": [
"All"
],
"value": [
"$__all"
]
},
"datasource": {
"type": "prometheus",
"uid": "$datasource"
},
"definition": "",
"hide": 2,
"includeAll": true,
"multi": true,
"name": "mempool",
"options": [],
"query": {
"query": "label_values(jvm_memory_pool_bytes_max{job=\"$job\", instance=\"$instance\"}, pool)",
"refId": "Prometheus-mempool-Variable-Query"
},
"refresh": 1,
"regex": "",
"skipUrlSync": false,
"sort": 1,
"tagValuesQuery": "",
"tagsQuery": "",
"type": "query",
"useTags": false
},
{
"current": {
"selected": true,
"text": [
"All"
],
"value": [
"$__all"
]
},
"datasource": {
"type": "prometheus",
"uid": "$datasource"
},
"definition": "",
"hide": 2,
"includeAll": true,
"multi": true,
"name": "memarea",
"options": [],
"query": {
"query": "label_values(jvm_memory_bytes_used{job=\"$job\", instance=\"$instance\"}, area)",
"refId": "Prometheus-memarea-Variable-Query"
},
"refresh": 1,
"regex": "",
"skipUrlSync": false,
"sort": 0,
"tagValuesQuery": "",
"tagsQuery": "",
"type": "query",
"useTags": false
}
]
},
"time": {
"from": "now-15m",
"to": "now"
},
"timepicker": {
"refresh_intervals": [
"5s",
"10s",
"30s",
"1m",
"5m"
],
"time_options": [
"5m",
"15m",
"1h",
"6h",
"12h",
"24h",
"2d",
"7d",
"30d"
]
},
"timezone": "",
"title": "JVM dashboard",
"uid": "chanjarster-jvm-dashboard",
"version": 3,
"weekStart": ""
}