<template>
<div>
<div id="container" />
<div @click="showFn">显示</div>
<div @click="removeFn">移除</div>
</div>
</template>
<script>
import AMapLoader from '@amap/amap-jsapi-loader'
import chinaData from './provincialData/中华人民共和国.json'
export default {
data() {
return {
map: null,
infoWindow: null,
markers: [],
provincPolygonList: []
}
},
async mounted() {
await this.initMap()
await this.setUpPlotsFn(chinaData)
},
methods: {
initMap() {
return new Promise((resolve) => {
window._AMapSecurityConfig = {
securityJsCode: '你的安全密钥'
}
AMapLoader.load({
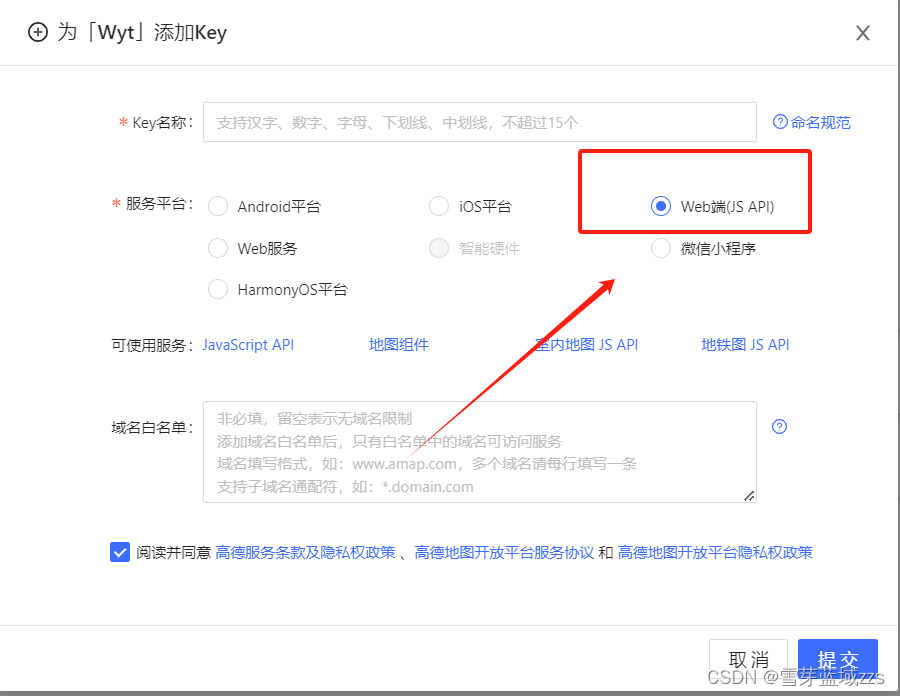
key: '697eb023cbaadfdf68211c7b18165ed7',
version: '2.0',
plugins: [
'AMap.DistrictSearch',
'AMap.GeoJSON'
]
})
.then((AMap) => {
this.map = new AMap.Map('container', {
center: [116.30946, 39.937629],
zoom: 3
})
this.map.on('complete', () => {
resolve()
})
})
.catch((e) => {
console.log(e)
})
})
},
setUpPlotsFn(featuresObj) {
const {
features } = featuresObj
features.forEach((item) => {
this.addGeoJsonFn(item)
})
this.map.add(this.provincPolygonList)
this.map.add(this.markers)
this.map.setFitView()
},
addGeoJsonFn(feature) {
const geoJSON = {
type: 'FeatureCollection',
features: [feature]
}
this.map.plugin('AMap.Geocoder', () => {
const polygon = new window.AMap.GeoJSON({
geoJSON: geoJSON,
getPolygon: function(geojson, lnglats) {
return new window.AMap.Polygon({
path: lnglats,
fillOpacity: 0.4,
fillColor: '#80d8ff',
strokeColor: '#08B2BD',
strokeWeight: 1,
map: this.map
})
}
})
const {
name, centroid } = feature.properties
console.log('🚀 ~ file: MapConnentNewLast.vue:89 ~ this.map.plugin ~ feature.properties:', feature.properties)
polygon.on('mouseover', (e) => {
polygon.setOptions({
fillOpacity: 0.7,
fillColor: '#08B2BD'
})
const info = []
info.push(
`<div style="font-size: 12px; background-color: #fff;padding: 10px; border-radius: 10px;"><div style="font-weight: 700;">${
name}</div>`
)
info.push(
'<div style="display: flex; justify-content: space-between;align-items: center;padding: 4px 0;"><span style="color:#666;padding-right: 10px;">聚合资源总量</span> <span style="font-weight: 700;">100MW</span></div>'
)
info.push(
'<div style="display: flex; justify-content: space-between;align-items: center;padding: 4px 0;"><span style="color:#666;">充电站</span> <span style="font-weight: 700;">100座</span></div>'
)
info.push(
'<div style="display: flex;justify-content: space-between;align-items: center;padding: 4px 0;"><span style="color:#666;">换电站</span> <span style="font-weight: 700;">100座</span></div>'
)
info.push(
'<div style="display: flex;justify-content: space-between;align-items: center;padding: 4px 0;"><span style="color:#666;">光伏</span> <span style="font-weight: 700;">100MW</span></div>'
)
info.push(
'<div style="display: flex; justify-content: space-between;align-items: center;padding: 4px 0;"><span style="color:#666;">储能</span> <span style="font-weight: 700;">100MWH</span></div></div>'
)
this.infoWindow = new window.AMap.InfoWindow({
isCustom: true,
content: info.join(''),
offset: new window.AMap.Pixel(0, -30)
})
const lnglat = e.lnglat
this.infoWindow.open(this.map, lnglat)
})
polygon.on('mouseout', () => {
this.infoWindow.close()
polygon.setOptions({
fillOpacity: 0.5,
fillColor: '#80d8ff'
})
})
this.provincPolygonList.push(polygon)
const center = this.$turf.centroid(geoJSON).geometry.coordinates
console.log('🚀 ~ file: MapConnentNewLast.vue:138 ~ this.map.plugin ~ center:', center)
if (name) {
this.addMarkerList(centroid || center, name)
}
})
},
addMarkerList(center, item) {
const markersContent = []
markersContent.push(`<div style="display: flex;align-items: center;font-size: 10px;border-radius: 4px;">`)
markersContent.push(
`<span style="color:#666;background-color: #fff;min-width: 40px;height: 20px;display: flex;align-items: center;justify-content:center">${
item}</span>`
)
markersContent.push(
`<span style="color:#fff;background-color: #3AD6C4;min-width: 40px;height: 20px;display: flex;align-items: center;justify-content:center">3213</span>`
)
markersContent.push(`</div>`)
const marker = new window.AMap.Marker({
position: center,
content: markersContent.join(''),
map: this.map
})
this.markers.push(marker)
},
removeFn() {
if (this.markers) {
this.markers.forEach((item) => item.hide())
this.provincPolygonList.forEach((item) => item.hide(item))
}
},
showFn() {
if (this.markers) {
this.markers.forEach((item) => item.show())
this.provincPolygonList.forEach((item) => item.show(item))
}
}
}
}
</script>
<style scoped lang="scss">
#container {
width: 100%;
height: 53vh;
}
.infoWindow {
display: flex;
flex-direction: column;
font-size: 10px;
.title {
color: #000;
}
.info_item {
display: flex;
justify-content: space-between;
align-items: center;
&:first-child {
span {
color: #444;
}
}
}
}
.amap-info-content {
border-radius: 10px;
}</style>