一、五种算法简介
1、哈里斯鹰优化算法HHO
2、鲸鱼优化算法WOA
3、灰狼优化算法GWO
4、粒子群优化算法PSO
5、遗传算法GA
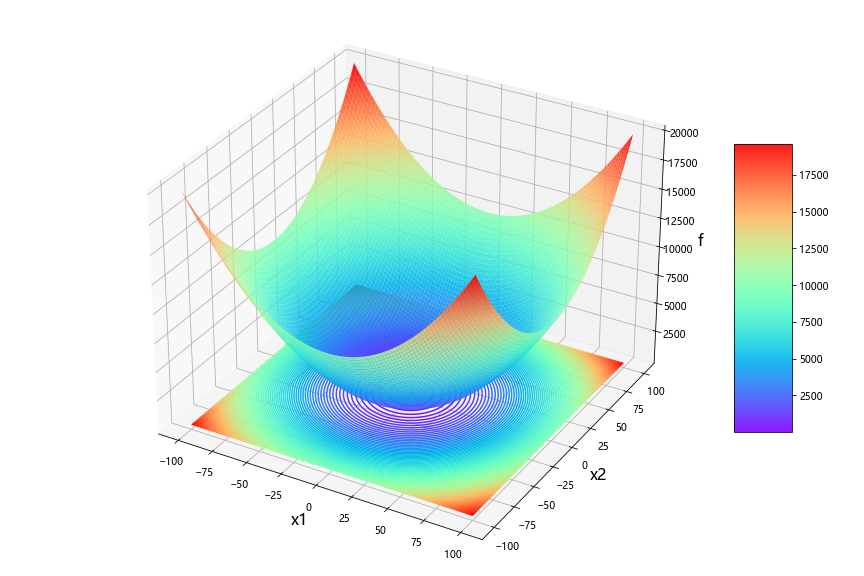
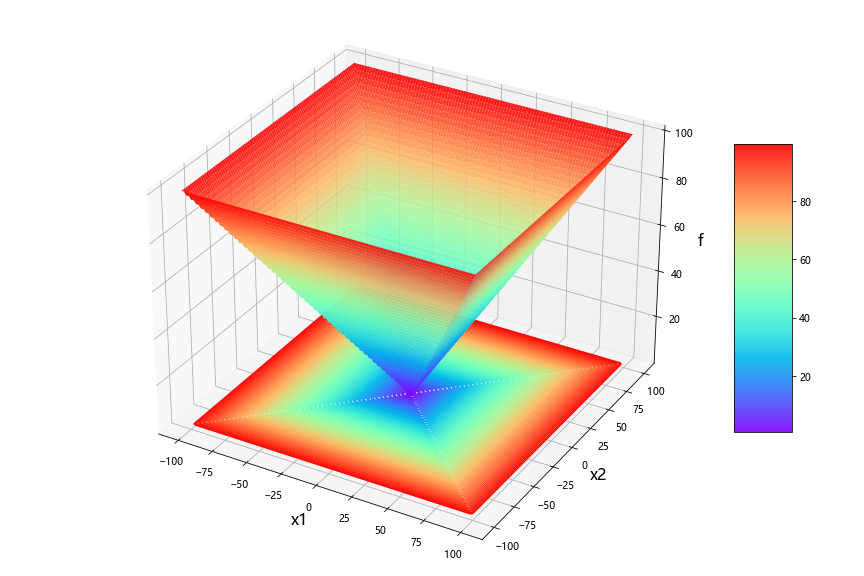
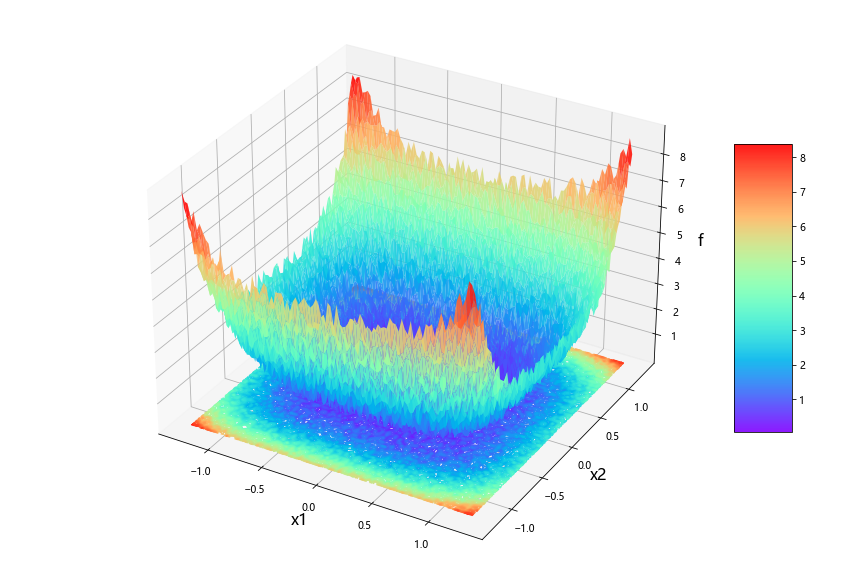
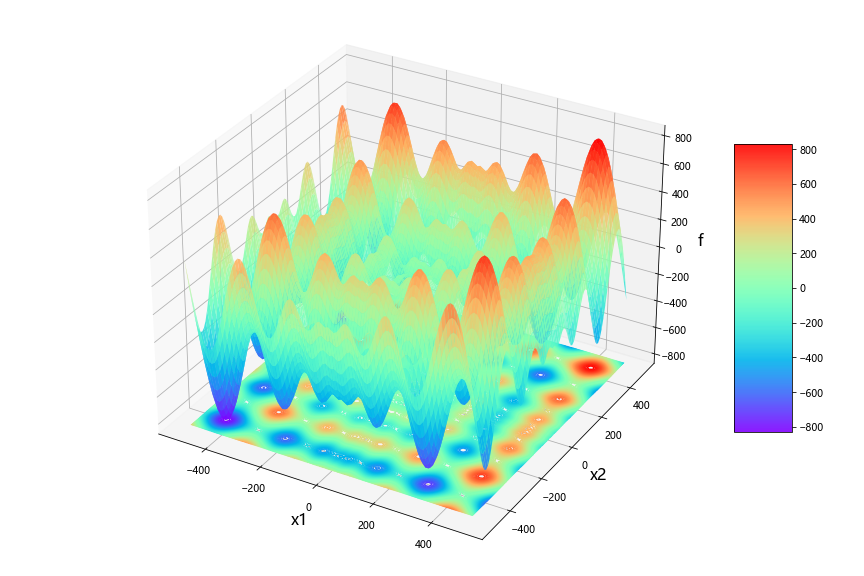
二、5种算法求解23个函数
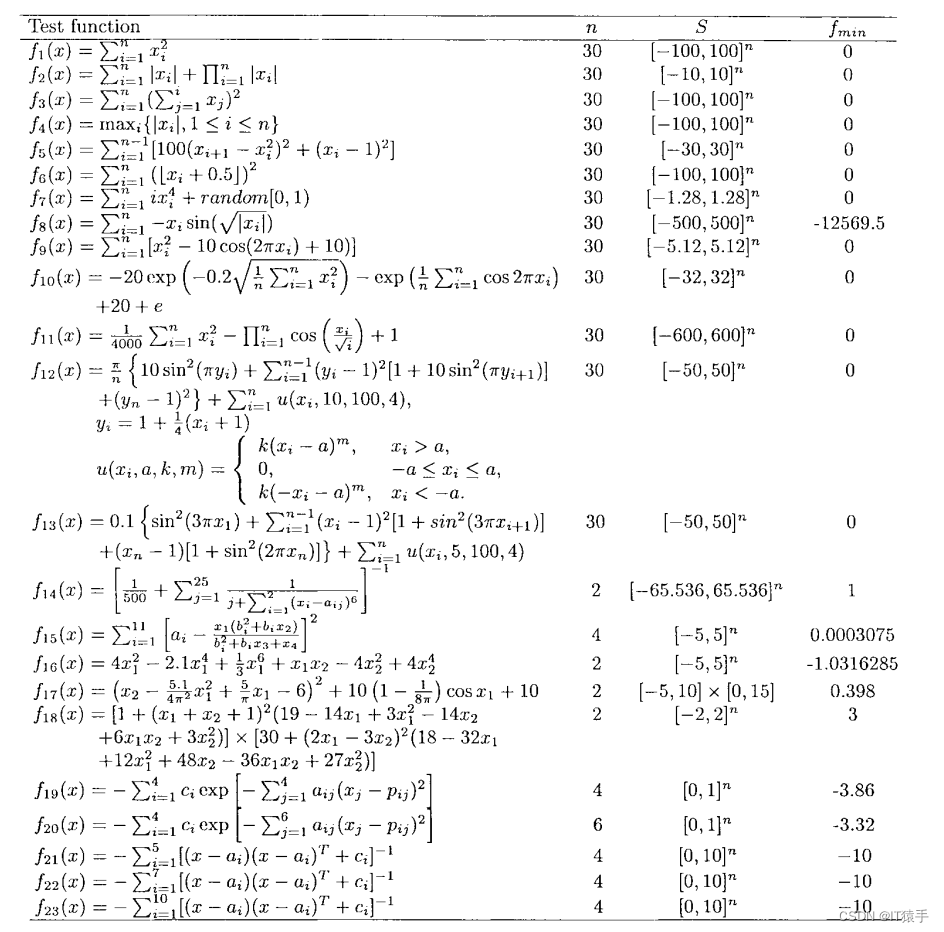
(1)23个函数简介

参考文献:
[1] Yao X, Liu Y, Lin G M. Evolutionary programming made faster[J]. IEEE transactions on evolutionary computation, 1999, 3(2):82-102.
(2)部分python代码
from FunInfo import Get_Functions_details
from WOA import WOA
from GWO import GWO
from PSO import PSO
from GA import GA
from HHO import HHO
import matplotlib.pyplot as plt
from func_plot import func_plot
plt.rcParams['font.sans-serif']=['Microsoft YaHei']
#主程序
function_name =8 #测试函数1-23
SearchAgents_no = 50#种群大小
Max_iter = 100#迭代次数
lb,ub,dim,fobj=Get_Functions_details(function_name)#获取问题信息
BestX1,BestF1,curve1 = WOA(SearchAgents_no, Max_iter,lb,ub,dim,fobj)#问题求解
BestX2,BestF2,curve2 = GWO(SearchAgents_no, Max_iter,lb,ub,dim,fobj)#问题求解
BestX3,BestF3,curve3 = PSO(SearchAgents_no, Max_iter,lb,ub,dim,fobj)#问题求解
BestX4,BestF4,curve4 = GA(SearchAgents_no, Max_iter,lb,ub,dim,fobj)#问题求解
BestX5,BestF5,curve5 = HHO(SearchAgents_no, Max_iter,lb,ub,dim,fobj)#问题求解
#画函数图
func_plot(lb,ub,dim,fobj,function_name)#画函数图
#画收敛曲线图
Labelstr=['WOA','GWO','PSO','GA','HHO']
Colorstr=['r','g','b','k','c']
if BestF1>0:
    plt.semilogy(curve1,color=Colorstr[0],linewidth=2,label=Labelstr[0])
    plt.semilogy(curve2,color=Colorstr[1],linewidth=2,label=Labelstr[1])
    plt.semilogy(curve3,color=Colorstr[2],linewidth=2,label=Labelstr[2])
    plt.semilogy(curve4,color=Colorstr[3],linewidth=2,label=Labelstr[3])
    plt.semilogy(curve5,color=Colorstr[4],linewidth=2,label=Labelstr[4])
else:
    plt.plot(curve1,color=Colorstr[0],linewidth=2,label=Labelstr[0])
    plt.plot(curve2,color=Colorstr[1],linewidth=2,label=Labelstr[1])
    plt.plot(curve3,color=Colorstr[2],linewidth=2,label=Labelstr[2])
    plt.plot(curve4,color=Colorstr[3],linewidth=2,label=Labelstr[3])
    plt.plot(curve5,color=Colorstr[4],linewidth=2,label=Labelstr[4])


plt.xlabel("Iteration")
plt.ylabel("Fitness")
plt.xlim(0,Max_iter)
plt.title("F"+str(function_name))
plt.legend()
plt.savefig(str(function_name)+'.png')
plt.show()
#
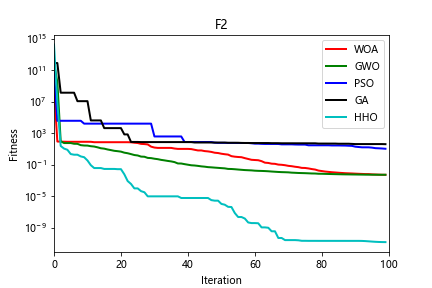
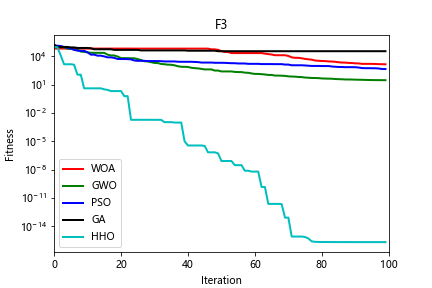
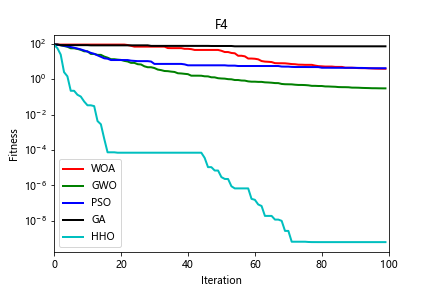
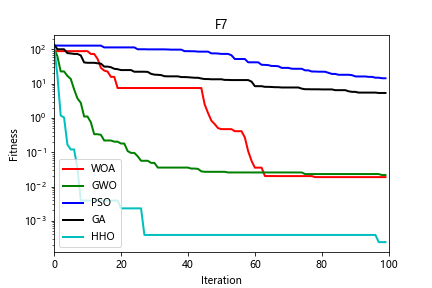
(3)部分结果