一、基础柱状图
# 基础柱状图
# 导包
from pyecharts.charts import Bar
from pyecharts.options import *

# 构建柱状图
bar = Bar()
# 添加数据(列表)
x_list = ["张三", "李四", "王五", "赵六"]
y_list = [50, 40, 60, 64]
bar.add_xaxis(x_list)
bar.add_yaxis("年龄", y_list)
# 设置全局配置


# 绘图
bar.render()
# 导包
from pyecharts.charts import Bar
from pyecharts.options import *

# 构建柱状图
bar = Bar()
# 添加数据(列表)
x_list = ["张三", "李四", "王五", "赵六"]
y_list = [50, 40, 60, 64]
bar.add_xaxis(x_list)
bar.add_yaxis("年龄", y_list, label_opts=LabelOpts(position="right"))  # 数值标签在右侧
# 反转xy轴
bar.reversal_axis()
# 绘图
bar.render()
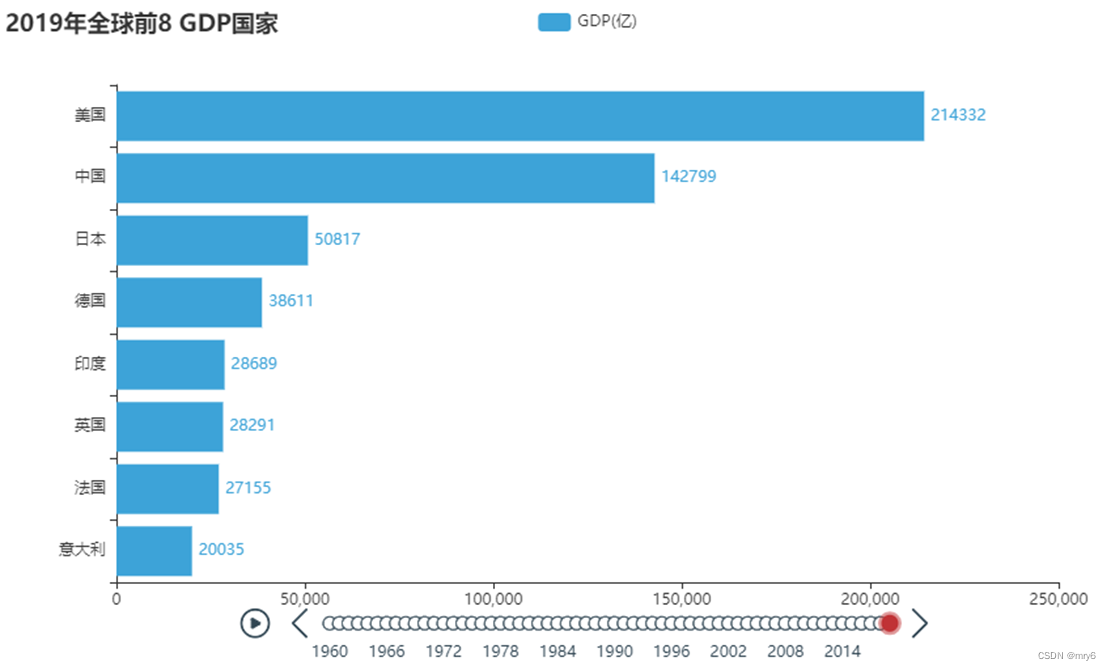
二、动态柱状图 (以gdp变化为例)
1、数据排序
#数据准备
my_list=[["a",33],["b",22],["c",11]]
#一、定义函数使用
def choose_sort_key(element):
    return element[1]
my_list.sort(key=choose_sort_key,reverse=True)#true降序
print(my_list)
#二、匿名函数
my_list.sort(key=lambda element:element[1],reverse=True)
print(my_list)
2、绘图
from pyecharts.charts import Bar, Timeline
from pyecharts.globals import ThemeType
from pyecharts.options import LabelOpts, TitleOpts

# 读取文件
f = open("C:\Users\33376\Desktop\1960-2019全球GDP数据.csv", "r",
         encoding="GB2312")
data_lines = f.readlines()
# 关闭文件
f.close()
# 删除第一条数据
data_lines.pop(0)
# 将数据转换为字典
data_dict = {}
for line in data_dict:
    year = int(line.split(",")[0])  # 年份
    country = line.split(",")[1]  # 国家
    gdp = float(line.split(",")[2])  # gdp有科学计数法用float转换
    try:
        data_dict[year].append([country, gdp])  # 将年份的国家gdp放一起
    except KeyError:
        data_dict[year] = []
        data_dict[year].append([country, gdp])
# 创建时间线
timeline = Timeline({"theme": ThemeType.LIGHT})
# 排序年份
sorted_year_list = sorted(data_dict.keys())
for year in sorted_year_list:
    data_dict[year].sort(key=lambda element: element[1], reverse=True)  # 以gdp排序
    # 取出每年前八国家
    year_data = data_dict[year][0 - 8]  # 通过年份取得国家极其gdp
    x_data = []
    y_data = []
    for country_gdp in year_data:
        x_data.append(country_gdp[0])  # 取出国家
        y_data.append(country_gdp[1] / 100000000)  # 取出gdp
    # 构建柱状图
    bar = Bar()
    x_data.reverse()
    y_data.reverse()
    bar.add_xaxis(x_data)
    bar.add_yaxis("GDP(亿)", year_data, label_opts=LabelOpts(position="right"))
    # 反转x轴y轴
    bar.reversal_axis()
    #设置每一年标题
    bar.set_global_opts(
        title_opts=TitleOpts(title=f"{year}年全球gdp前8数据")
    )
    timeline.add(bar, str(year))
# 设置自动播放
timeline.add_schema(
    play_interval=1000,
    is_timeline_show=True,
    is_auto_play=True,
    is_loop_play=False
)  # 一秒播放一次,显示,自动播放,不循环播放
# 绘图
timeline.render("1960-2019全球GDP前8国家.html")