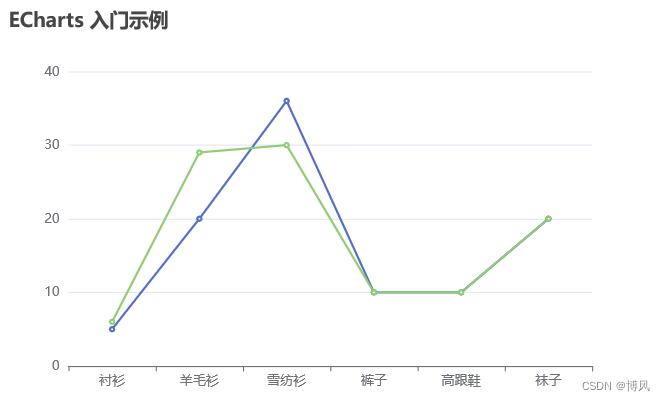
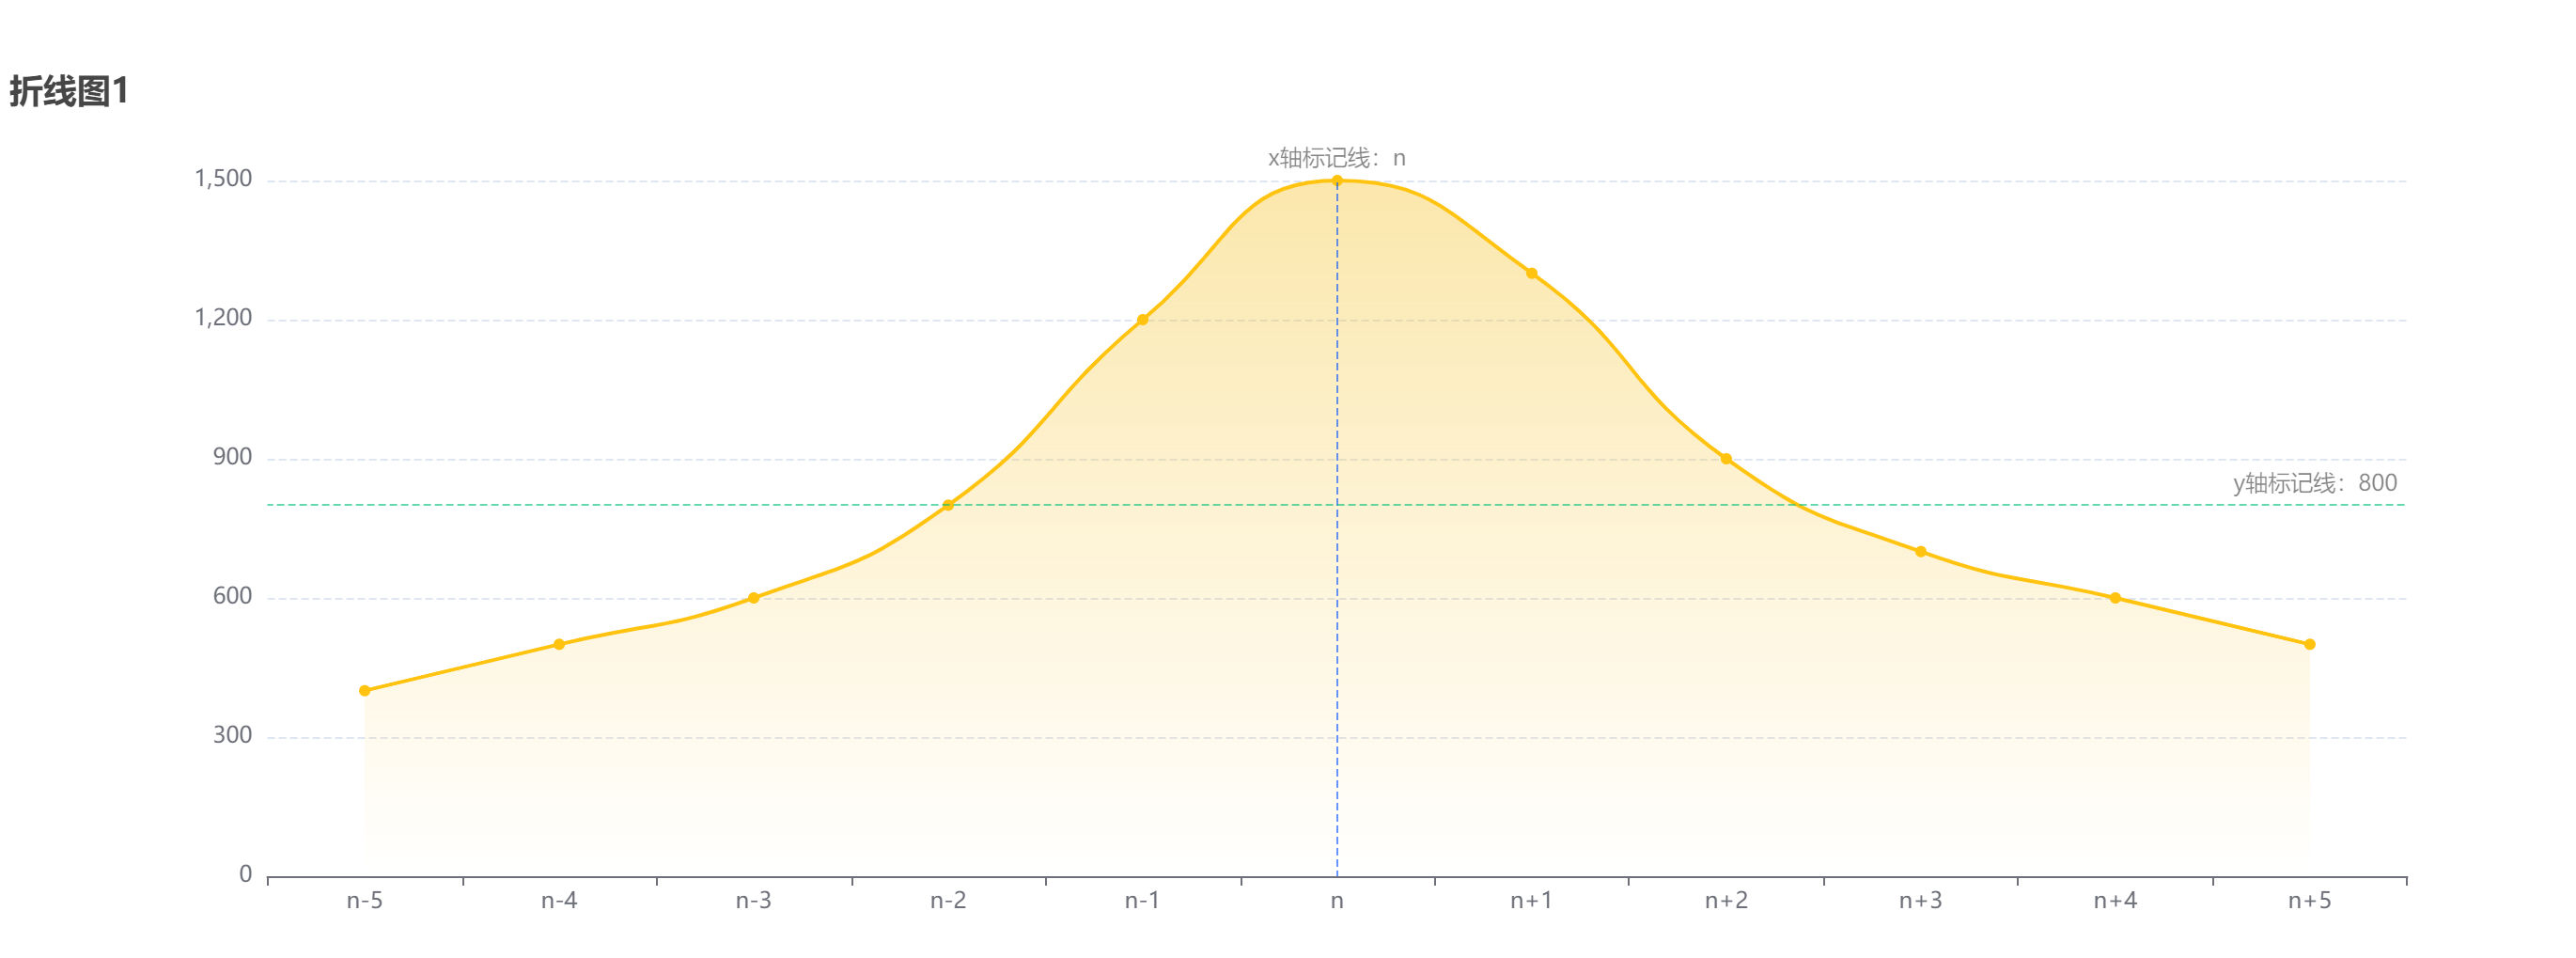
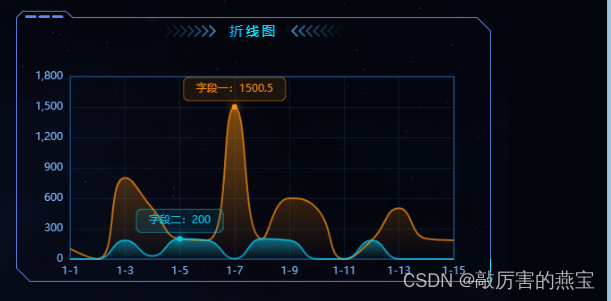
Echarts折线图---带颜色过度---的小demo

效果:

代码:

<template>
  <div id="lineEchtar">
    <div id="lineEchtars" style="min-height: 300px; width: 100%"></div>
  </div>
</template>

<script>
import * as echarts from "echarts";
//import { abc } from "@/api/a/index";//接口在这里计入数据

export default {
  data() {
    return {
      myChart: null,
      xAxis: [],
      yAxis: []
    };
  },
  components: {},
  mounted() {
    this.getList();
  },
  methods: {
    getList() {
      abc().then(response => {//在这里获取数据  我这里先前端给了,后期res赋值就行
        this.xAxis =  ["2024-07-10","2024-07-09","2024-07-08","2024-07-07","2024-07-06","2024-07-05","2024-07-04"];
        this.yAxis = [150, 134, 224, 118, 235, 147, 260];
        this.interEchinterfun();   //得再接口异步执行后获取实例 要不获取不到
      });
    },
//Echarts图表方法
    interEchinterfun() {
      var chartDom = document.getElementById("lineEchtars");
      var myChart = echarts.init(chartDom);
      var option;
      option = {
        //图例显示区域
        tooltip: {
          trigger: "axis",
          backgroundColor: "rgba(8,11,21,0.5)",
          textStyle: {
            color: "#fff"
          }
        },
        xAxis: {
          type: "category",
          boundaryGap: false,
          data: this.xAxis
        },
        yAxis: {
          type: "value",
          splitLine: {
            show: true, // 设置为 false 隐藏 Y 轴线
            lineStyle: {
              color: "#65C6E7",
              opacity: 0.2
            }
          }
        },
        series: [
          {
            data: this.yAxis,
            type: "line",
            smooth: true,//控制折线图圆弧行拐弯的
            areaStyle: {//颜色渐变
              normal: {
                color: {
                  x: 0,
                  y: 0,
                  x2: 0,
                  y2: 1,
                  //颜色过渡
                  colorStops: [
                    {
                      offset: 0.1,
                      color: "#00F4FD" // 线处的颜色
                    },
                    {
                      offset: 0.9,
                      color: "rgba(255,255,255,0.1)" // 坐标轴处的颜色
                    }
                  ]
                }
              }
            }
          }
        ]
      };

      option && myChart.setOption(option);
    }
  }
};
</script>

相关推荐

  1. 自定义折线图颜色 Python

    2024-07-13 06:38:02       51 阅读

最近更新

  1. docker php8.1+nginx base 镜像 dockerfile 配置

    2024-07-13 06:38:02       70 阅读
  2. Could not load dynamic library ‘cudart64_100.dll‘

    2024-07-13 06:38:02       74 阅读
  3. 在Django里面运行非项目文件

    2024-07-13 06:38:02       62 阅读
  4. Python语言-面向对象

    2024-07-13 06:38:02       72 阅读

热门阅读

  1. MyBatis(35)如何在 MyBatis 中实现软删除

    2024-07-13 06:38:02       25 阅读
  2. XML 应用程序

    2024-07-13 06:38:02       24 阅读
  3. 在Ubuntu 16.04上安装和保护MongoDB的方法

    2024-07-13 06:38:02       21 阅读
  4. 各个系统配置端口转发

    2024-07-13 06:38:02       21 阅读
  5. 地下城游戏中都有哪些类型的服务器?

    2024-07-13 06:38:02       25 阅读
  6. MongoDB部署模式分析

    2024-07-13 06:38:02       25 阅读
  7. Docker 安装 PostgreSQL

    2024-07-13 06:38:02       28 阅读
  8. MongoDB 数据库引用

    2024-07-13 06:38:02       26 阅读
  9. LINQ详解

    2024-07-13 06:38:02       22 阅读
  10. 三级_网络技术_14_局域网技术基础及应用

    2024-07-13 06:38:02       25 阅读
  11. TCP网络传输控制协议

    2024-07-13 06:38:02       26 阅读