clc;clear all;close all
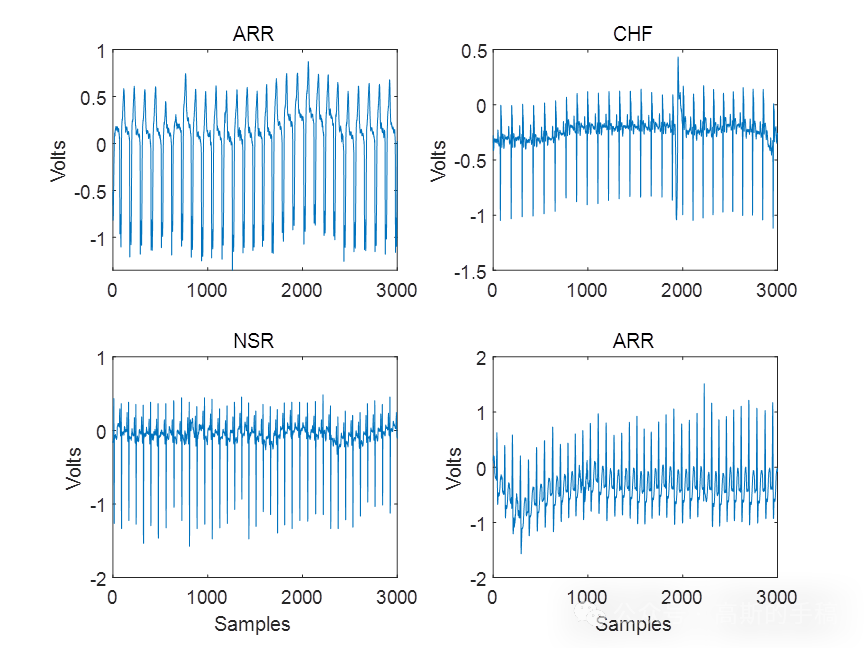
%% Loading ECG signal
%ECG signal is loaded by the website https://archive.physionet.org/cgi-bin/atm/ATM
load('00m.mat'); %00m.mat file is loaded
%From the file file_name.info from the website, gain, sampling frequency and base can be found
%Formula to implement is var = (val - base)/gain
ECGsignal = (val - (-23942))/30044.2;
Fs = 1000; %Sampling Frequency
t = (0:length(ECGsignal)-1)/Fs;
%%
%Filtering Functionality
%Implementing Lynn's Filters
%LPF
%Difference Equation is y[n] = 2y[n-1] + x[n] - 2x[n-alpha] + x[n-2*alpha]
%Implementing Coefficients for alpha = 6
x1 = [1 0 0 0 0 0 -2 0 0 0 0 0 1];
y1 = [1 -2 1];
%HPF
%Difference Equation is y[n] = y[n-1] - x[n]/alpha + x[n-(alpha-1)/2] - x[n-((alpha-1)/2) -1] +x[n-alpha]/alpha
%Implementing coefficients for alpha = 321
x2 = [-1/321 zeros(1,160) 1 -1 zeros(1,159) 1/321];
y2 = [1 -1];
%Getting Filtered Output
Clear_ECGsignal = filter(x2,y2,ECGsignal); %Application of HPF
Clear_ECGsignal = filter(x1,y1,ECGsignal); %Application of LPF
%%
%Sampling Functionality
% M = Sampling Factor <= pi/sampling period * maximum frequency of signal;
%Maximum frequency of signal is half the sampling frequency so range of M can be determined
M = 50;
Sampled_Clear_ECGsignal = Clear_ECGsignal(1:M:end);
%%
%Predicting Average Heart Rate Functionality
%Steps:
%1: Removing Lower Frequencies
%2: Filtering phase-1 i.e default Window size
%3: Detecting Peaks in Filtered ECG
%4: Filtering Phase-2 i.e Optimized Window Size
%5: Detecting Peaks
%6: Using algorithm for Heart Rate Caluclation by using detected peaks
%Removing lower frequencies
%Taking FFT
fft_out = fft(Clear_ECGsignal);
%Filtering
temp = round(length(fft_out));%Rounding off the fft length so that the low frequency samples are easily zeroed out
fft_out(1 : temp*5/Fs) = 0;%zero out the low frequency components before the main lobes
fft_out(end - round(length(fft_out)*5/Fs) : end) = 0;%zero out the after mian lobe low frequency components
%Taking Inverse FFT
corrected = real(ifft(fft_out));%ignoring the small imaginary parts
%Filtering - first pass
Window = floor(Fs * 571 / 1000);%making a window
if rem(Window,2)==0%catering the zeroth element
Window = Window + 1;%window should be odd numbered
end
%applying window to filter out the signal
Filter_out = filter(Window,1,corrected)%applying window to our signal
%Scaling
Peaks_after_1stphase = Filter_out/(max(Filter_out)/7);%undo the effect of the filter magnitude attenuation
%as we need the peak value same as from the lynns filter output i.e.
%magnified & so not to attenuate it
%Filtering by threshold filter
for temp = 1:1:length(Peaks_after_1stphase) %Loop running over the whole length
%If less than threshold then make it zero
%we are zeroeing out the peaks in the time domain which are below the
%threshold and making peaks equal to 1 which are above threshold
%this is done to calculate the average heart rate which requires only
%certain peaks above threshold to participate
if Peaks_after_1stphase(temp) < 4
Peaks_after_1stphase(temp) = 0;
else
Peaks_after_1stphase(temp)=1;
end
end
index_pos = find(Peaks_after_1stphase);%finding the x-coordinates of peaks
min_distance = index_pos(2) - index_pos(1);%distance between peaks
%this is used in the formula i.e all three peaks participate
%Returning minimum distance between two peaks
for temp=1:1:length(index_pos)-1
if index_pos(temp+1)-index_pos(temp) < min_distance
min_distance = index_pos(temp+1)-index_pos(temp);%updating the minimum position
end
end
%finding the distance of the start to peak of main central lobe (Q-R)
%this is done on the basis of previous min_distance
DistanceQtoR = floor(0.04*Fs);%window size
if rem(DistanceQtoR,2)==0
DistanceQtoR = DistanceQtoR+1;%catering zeroth index
end
Window = 2*min_distance - DistanceQtoR;%now window is optimized
%formula calculated only for ECG signals
%Filtering - second pass
%Applying the window to filter out the signal
Filter_out2 = filter(Window,1,corrected)%applying window to our signal
Peaks_after_2ndphase = Filter_out2;
%Loop running over the whole length
for temp=1:1:length(Peaks_after_2ndphase)
%If less than threshold then make it zero
%we are zeroeing out the peaks in the time domain which are below the
%threshold and making peaks equal to 1 which are above threshold
%this is done to calculate the average heart rate which requires only
%certain peaks above threshold to participate
if Peaks_after_2ndphase(temp)<4
Peaks_after_2ndphase(temp)=0;
else
Peaks_after_2ndphase(temp)=1;
end
end
%Calculating Average Heart Rate
Index_pos2 = find(Peaks_after_2ndphase); %Finding peaks x-coordinates
Total_Distance = (Index_pos2(length(Index_pos2))-Index_pos2(1))*Fs*0.37; %Measuring Total Distance b/w the peaks and undoing the
%effect of 2nd window attenuation
AveragePeakDistance = Total_Distance/length(Index_pos2); %Implementing average formula
%% Plotting the
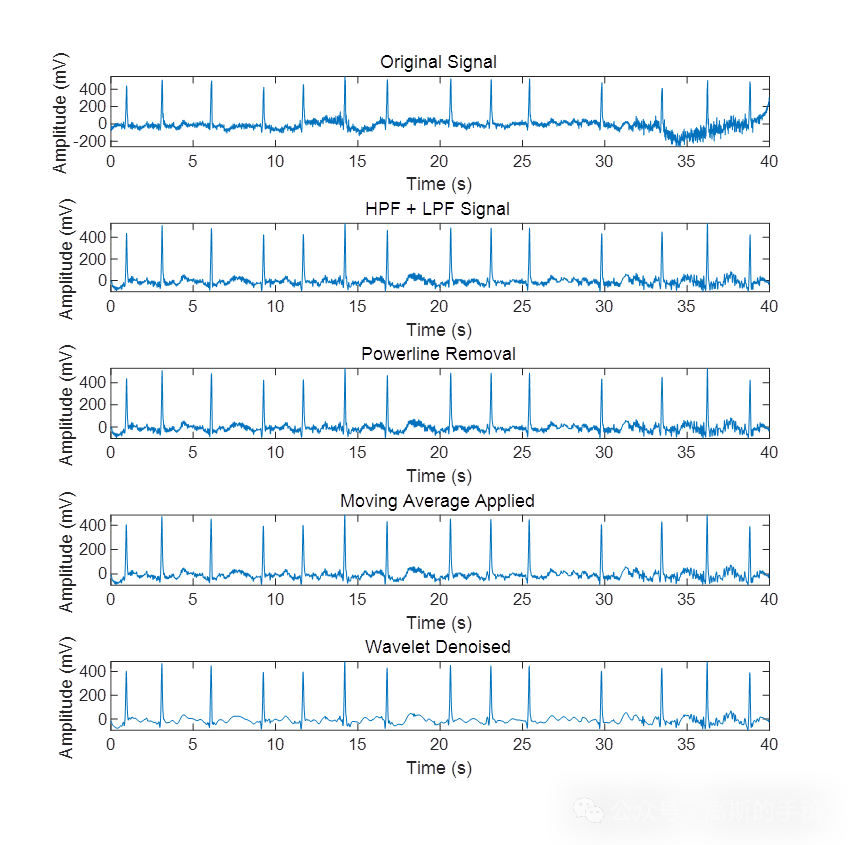
%Original Signal
subplot(3,1,1)
plot(t,ECGsignal)
title('Original Signal')
xlabel('Time')
ylabel('Signal Amplitude')
%Filtered Signal
subplot(3,1,2)
plot(t,Clear_ECGsignal)
title('Filtered Output')
xlabel('Time')
ylabel('Signal Amplitude')
%Sampled Signal
subplot(3,1,3)
stem(Sampled_Clear_ECGsignal)
title('Sampled Output')
xlabel('Samples')
ylabel('Signal Amplitude')
%% Finding the Average Heart Rate
%Formula for finding average heart beat rate
Output = 60 * Fs/AveragePeakDistance; %Multiplied by 60 because of finding rate in a minute
%Average Heart Rate OF Normal Person Is 60 - 100 per min.
%We can test for any different waveform
%% Displaying
disp('Signal Filtered (see plot)');
disp('Signal sampled by the factor of ');
disp(M);
disp('Average Heart Rate calulated = ');
disp(Output);
知乎学术咨询:https://www.zhihu.com/consult/people/792359672131756032?isMe=1擅长领域:现代信号处理,机器学习,深度学习,数字孪生,时间序列分析,设备缺陷检测、设备异常检测、设备智能故障诊断与健康管理PHM等。