前言
本人自己的练习记录;如有错误请指正;
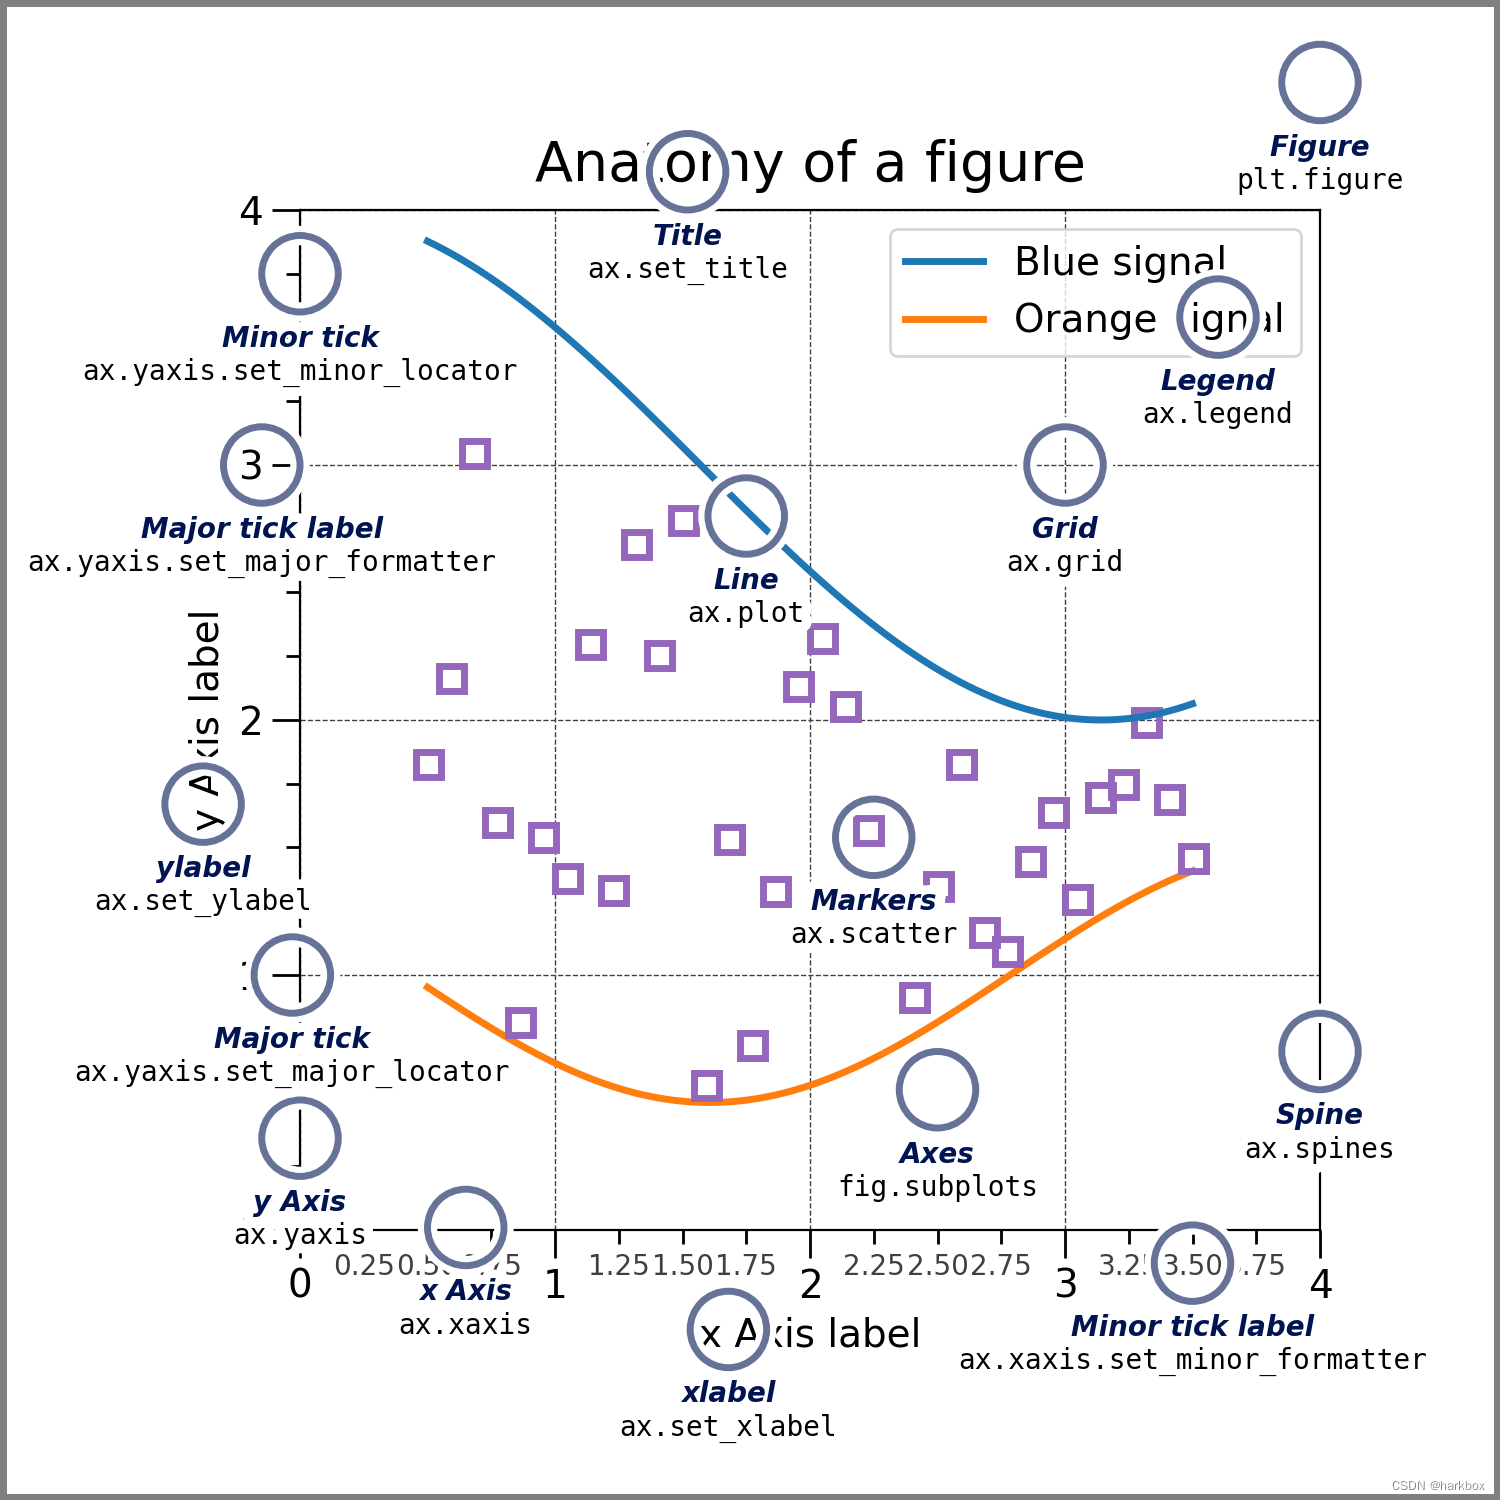
https://matplotlib.org/stable/gallery/lines_bars_and_markers/index.html
官方有许多例子,可以找到自己需要的图像模仿进行绘制
1.一个简单的直线例子
就如同我们学习C语言的第一个helloword时候一样;我们也了解最基本的例子;关于具体细节可以不需要第一时间了解
import matplotlib.pyplot as plt
#准备数据
x_values=list(range(0,10))
y_values=list(range(0,10))
#绘制图像
fig,ax=plt.subplots()
plt.plot(x_values,y_values)
plt.show()
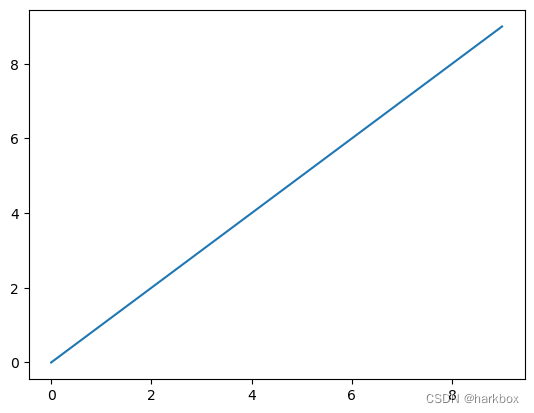
现在;你可以任意更改x_values与y_values的值;来画出一条简单的直线。
2.将简单的直线完善一下
通过这张图片,我们可以了解到更多东西。现在我们试着为这幅图像设置标题,x轴名字,y轴名字等属性
import matplotlib.pyplot as plt
#准备数据
x_values=list(range(0,10))
y_values=list(range(0,10))
#绘制图像
fig,ax=plt.subplots()

plt.plot(x_values,y_values,linewidth=10,c='red')
ax.set_title("example",fontsize=24)
ax.set_xlabel('x',fontsize=14)
ax.set_ylabel('y',fontsize=14)
#设置刻度的大小;axis=both表示x轴与y轴都选;大小变为14
#也可以axis='y'或者'x'
ax.tick_params(axis='both',labelsize=14)

plt.show()
3.插入figure(图形)和axes的介绍
可以简单的理解figure就是一个空白的图层,创建axes就是在里面创建坐标轴
fig=plt.figure()#一个空的图形对象;没有axes
fig,ax=plt.subplots()#一个图形对象对应一个axes
fig,axs=plt.subplots(2,2)#一个图像有四个网格的axes
#创建三个axes,一个在左侧;另外两个在右侧
fig,axs=plt.subplot_mosaic([['left','right_top'],['left','right_bottom']])
#这样使用子图层
axs['left'].set_title("left")

plt.show()
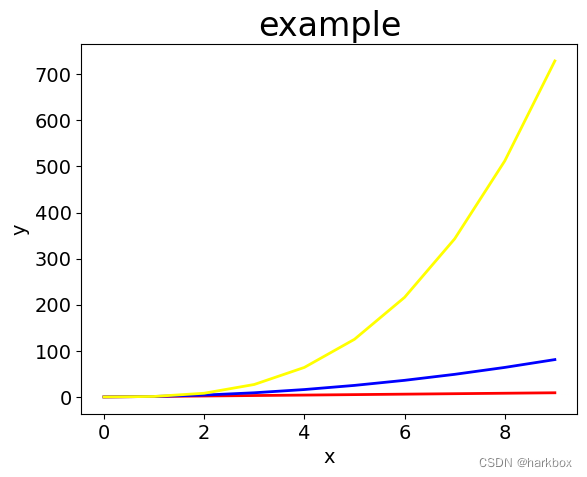
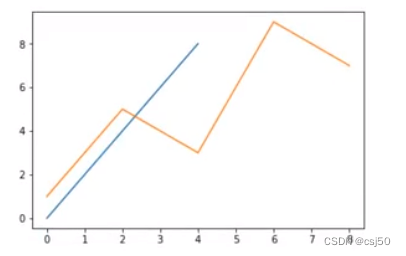
3绘制多条颜色不同的直线
import matplotlib.pyplot as plt
#准备数据
x_values=list(range(0,10))
y_values=list(range(0,10))
y_values1=[value**2 for value in range(0,10)]
y_values2=[value**3 for value in range(0,10)]
#绘制图像
fig,ax=plt.subplots()

ax.plot(x_values,y_values,linewidth=2,c='red')
ax.set_title("example",fontsize=24)
ax.set_xlabel('x',fontsize=14)
ax.set_ylabel('y',fontsize=14)
ax.tick_params(axis='both',labelsize=14)
ax.plot(x_values,y_values1,c='blue',linewidth=2)
ax.plot(x_values,y_values2,c='yellow',linewidth=2)

plt.show()
4绘制简单的散点图
import matplotlib.pyplot as plt
from random import randint

x_values=[randint(0,10) for i in range(0,10)]
y_values=[randint(0,20) for j in range(0,10)]

fig,ax=plt.subplots(figsize=(5,2.7))
ax.scatter(x_values,y_values,linewidth=2,c='red')
ax.set_title('san dian tu',fontsize=24)
ax.set_xlabel('x',fontsize=14)
ax.set_ylabel('y',fontsize=14)

plt.show()
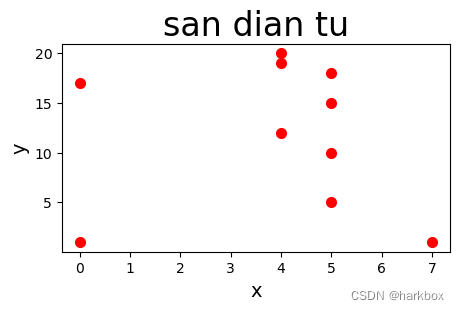
我的中文显示有问题;这里用拼音
使用颜色映射;根据y值,进行从浅到深的映射
ax.scatter(x_values,y_values,linewidth=2,c=y_values,cmap=plt.cm.Reds)
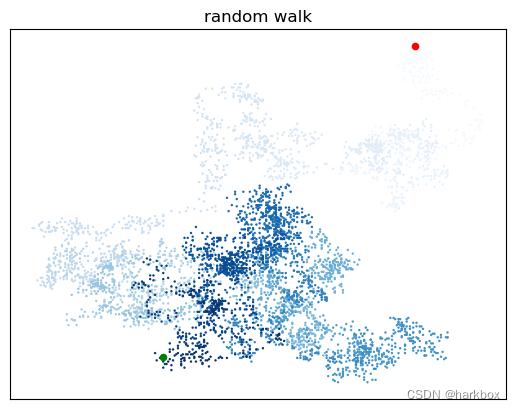
5随机漫步实战
抽象一个漫步类,默认步数是5000,用scatter打印出来
from random import choice
import matplotlib.pyplot as plt
import matplotlib

class RandomWalk:
    """随机漫步类"""

    def __init__(self,num_points=5000):
        self.num_points=num_points
        self.x_values=[0]
        self.y_values=[0]

    def walk(self):

        while len(self.x_values) < self.num_points:
            x_direction=choice([-1,1])
            y_direction=choice([-1,1])
            x_distance=choice([0,1,2,3,4,5])
            y_distance=choice([0,1,2,3,4,5])
            x_step=x_direction*x_distance
            y_step=y_direction*y_distance

            #不允许原地踏步
            if x_step == 0 and y_step == 0:
                continue
            x=self.x_values[-1]+x_step
            y=self.y_values[-1]+y_step
            self.x_values.append(x)
            self.y_values.append(y)


num_points=5000
walkrandom=RandomWalk(num_points)
walkrandom.walk()

fig,ax=plt.subplots()
#保存各点的先后顺序
point_nums=range(walkrandom.num_points)
ax.scatter(walkrandom.x_values,walkrandom.y_values,s=3,c=point_nums,cmap=plt.cm.Blues,edgecolors='none')
ax.set_title('random walk')
ax.set_xlabel('x')
ax.set_ylabel('y')

#将开始点设置的醒目一些
ax.scatter(0,0,s=20,c='red')
#结尾点同理
ax.scatter(walkrandom.x_values[-1],walkrandom.y_values[-1],s=20,c='green')

#隐藏坐标轴
ax.get_xaxis().set_visible(False)
ax.get_yaxis().set_visible(False)

plt.show()


![[蓝桥杯]真题讲解:合并数列(双指针+贪心)](https://img-blog.csdnimg.cn/direct/e26e6d2185fe4561bf107ed0eac4694f.png)