Title
题目
Improving breast cancer diagnostics with deep learning for MRI
使用深度学习改善乳腺癌诊断的MRI技术
01
文献速递介绍
乳腺磁共振成像(MRI)是一种高度敏感的检测乳腺癌的方式,报道的敏感性超过80%。传统上,其在筛查中的使用被限制在高风险患者身上。新的证据支持在中等风险和普通风险女性中进行筛查MRI的作用4)。诊断MRI对于额外的指示也很有用,如解决问题和最近诊断出乳腺癌的患者。随着接受乳腺MRI检查的患者数量持续增加,保持高特异性和高阳性预测值(PPV)以减少不必要的活检和后续建议变得非常重要。在中等和普通风险女性的筛查MRI研究中,活检推荐的PPV范围从19.6%到35.7%。这意味着每进行一次恶性发现的活检,就有两到四次良性结果的活检。因此,需要开发经过良好测试的工具来提高MRI的性能并提高护理质量。此外,还需要开发考虑临床医生或患者偏好的工具,例如,在决定是否进行活检时。
人工智能对医学研究,包括乳腺成像,产生了巨大影响。已经显示它能够在全视野乳房X光摄影、数字乳腺断层摄影、乳腺超声和乳腺MRI中提高乳腺癌的检出率。尽管关于乳腺成像的深度学习(DL)发布的研究通常展示出良好的分类性能,但潜在的临床影响通常未被探索。此外,评估外部和异质数据集对于验证DL系统可能在不同人群中的表现至关重要。提供广泛的、面向患者的结果对于赢得从业者的信任是必要的。此外,它构建了证据,使得研究结果能够转化为前瞻性研究,最终转化为临床实践。
在我们的论文中,我们描述了一个DL系统,用于预测接受动态对比增强MRI(DCE-MRI)的患者患有乳腺癌的概率。该系统的主要用途是提高DCE-MRI的特异性,从而减少假阳性发现的数量,进而导致良性发现的活检次数减少。我们使用传统的诊断准确性指标(接收者操作特征曲线下面积(AUROC)、精确召回曲线下面积(AUPRC)、敏感性、特异性、PPV和阴性预测值)和评估临床效用影响决策的方法,如决策曲线分析(DCA),对其性能进行了广泛评估,包括在内部和国际外部数据集上的表现。我们将DL系统的表现与放射科医生在一项回顾性读者研究中的表现进行了比较。我们还探讨了该系统在不同患者亚组中的表现,并检查了DL系统未能提供正确诊断的案例。最后,我们分析了一个特定的临床情景——个性化管理BI-RADS(乳腺成像报告和数据系统)4发现的患者——从而减少不必要的活检。
Results
结果
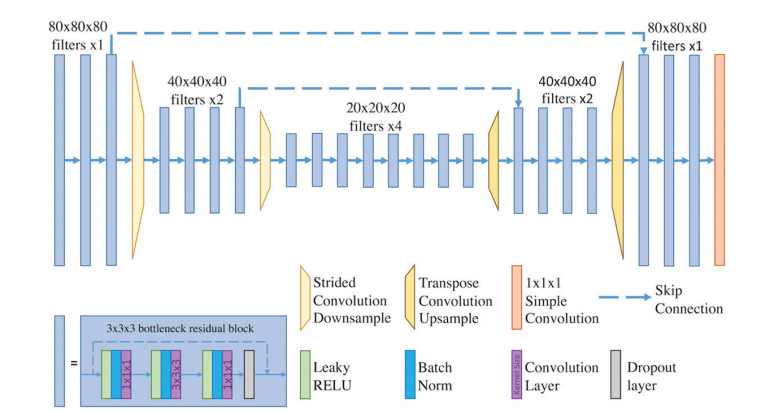
The DL system described in this study (Fig. 1) was trained in a su pervised manner, that is, the machine learning model was provided with many examples of inputs and correct outputs. The inputs of this system were DCE-MRI pre- and postcontrast sequences, all stored as three-dimensional (3D) volumes. This approach mimics clini cal practice, in which radiologists evaluate changes in contrast en hancement in breast to correctly identify suspicious areas. DCE-MRI volumes are passed through the model, which generates predic tions of the breast-level probability of malignancy (POM). That is, for each of the patient’s breasts, the system produces a number in a range between 0 and 1. The underlying neural network of the system performs 3D convolutions, which are mathematical opera tions that ultimately allow it to extract spatiotemporal features of the inputs.
本研究中描述的DL系统(图1)是以监督方式训练的,即,机器学习模型被提供了许多输入及其正确输出的示例。该系统的输入是DCE-MRI前后对比序列,所有这些都存储为三维(3D)体积。这种方法模仿了临床实践,其中放射科医生评估乳腺对比增强的变化,以正确识别可疑区域。DCE-MRI体积通过模型传递,该模型生成乳腺恶性概率(POM)的预测。也就是说,对于患者的每个乳腺,系统产生一个在0到1之间的数字。该系统的底层神经网络执行3D卷积,这些数学操作最终允许它提取输入的时空特征。
Methods
方法
The purpose of this study was to develop and evaluate a DL system for predicting the probability of breast cancer in DCE-MRI. To do so, we collected a dataset of 21,537 DCE-MRI examinations from the NYU Langone Health sites. We used it to train, validate, and test the system. In addition, we used three independent, international data sets for external validation of our model. The DL system is based on a modified 3D-ResNet18 architecture, which uses 3D convolutions to learn spatiotemporal features. Our training procedure used ele ments of transfer learning, multitask learning, and both train-time augmentation and test-time augmentation (TTA). The final DL sys tem is an ensemble of the most accurate 20 models selected from a larger pool of models trained with different hyperparameters.Beyond analyzing the system’s standalone performance, we simu lated a “hybrid performance” by averaging radiologists’ and system’s predictions. Last, we used DCA methodology to demonstrate that sys tem’s predictions can accurately identify low-risk BI-RADS category 4 lesions and help in avoiding unnecessary biopsies. The study was approved by the Institutional Review Board, and the informed con sent requirement was waived.
本研究的目的是开发并评估一个深度学习(DL)系统,用于预测DCE-MRI中乳腺癌的概率。为此,我们收集了来自NYU Langone Health站点的21,537个DCE-MRI检查数据集。我们使用它来训练、验证和测试系统。此外,我们使用了三个独立的国际数据集对我们的模型进行外部验证。该DL系统基于修改后的3D-ResNet18架构,该架构使用3D卷积来学习时空特征。我们的训练程序使用了迁移学习、多任务学习的元素,以及训练时增强和测试时增强(TTA)。最终的DL系统是从使用不同超参数训练的更大模型池中选出的最准确的20个模型的集成。
除了分析系统的独立性能外,我们还模拟了通过平均放射科医师和系统的预测来得出的“混合性能”。最后,我们使用DCA方法论来证明系统的预测能够准确识别低风险BI-RADS类别4的病变,并帮助避免不必要的活检。该研究已经得到机构审查委员会的批准,且知情同意要求被豁免。
Fig
图

Fig. 1. Overview of the study. In this work, we trained and evaluated a DL system based on deep neural networks that predict the probability of breast cancer in DCE-MRI examinations. Data collection and processing: To build the system, we collected 21,537 DCE-MRI imaging exams, consisting of one precontrast and two postcontrast T1-weighted fat-saturated sequences. We also collected diagnosis information from breast pathology reports to generate ground truth labels. Auxiliary information on patient demographics, tumor histological data, and radiological features enabled extensive subgroup analysis. Internal and external datasets: The internal dataset was collected from the NYU Langone Health system and divided into training (n = 14,198), validation (n = 3403), and test (n = 3936) subsets. We applied additional filtering on the test subset of NYU dataset to reduce potential label noise. To evaluate our system on data that the model had not seen before, we acquired three external datasets from Duke University (United States; n = 922), JU (Poland; n = 394), and TCGA-BRCA (United States; n = 131). Standalone evaluation of DL model: Using the NYU Langone training data subset, we trained deep neural networks to predict the probability of malignancy in MRI examinations. Our model was validated using standard metrics area under the receiver operating characteristic curve (AUROC) and area under the precision-recall curve (AUPRC). The plot presents ROC curves for all datasets. Reader study:
To compare the performance of DL system to experts, five readers and the DL system interpreted 100 random MRI examinations and provided their predictions of prob ability of breast cancer presence in MRI examinations. We also simulated combining DL and radiologists’ predictions by averaging them into a “hybrid” prediction. DL performance in subgroups: To confirm that our model works well in all subgroups, we performed an analysis of the model’s performance across various subsets (with respect to demographic data, imaging features, and histological features). The grid subplot presents DL model performance in each subgroup (columns) across four metrics (rows). Detailed results are presented in the “Subgroup analyses” section. Personalizing management: We simulated a scenario that assessed whether the model could correctly identify low-risk patients with BI-RADS 4 lesions who might avoid an unnecessary biopsy (that is, a biopsy yielding benign results). This simulation included 956 patients from the NYU dataset and used a decision curve analysis (DCA) methodology. AI, artificial intelligence; EHR, electronic health record; FPR, false positive rate; TPR, true positive rate.
图 1. 研究概述。在这项工作中,我们训练并评估了一个基于深度神经网络的DL系统,该系统预测DCE-MRI检查中乳腺癌的概率。数据收集和处理:为了构建系统,我们收集了21,537份DCE-MRI影像检查,包括一份前对比和两份后对比的T1加权脂肪饱和序列。我们还从乳腺病理报告中收集了诊断信息以生成真实标签。关于患者人口统计学、肿瘤组织学数据和放射学特征的辅助信息使得能够进行广泛的亚组分析。内部和外部数据集:内部数据集是从纽约大学兰贡医疗系统收集的,并分为训练(n = 14,198)、验证(n = 3403)和测试(n = 3936)子集。我们对纽约大学数据集的测试子集应用了额外的过滤,以减少潜在的标签噪声。为了评估我们的系统在模型之前未见过的数据上的表现,我们从杜克大学(美国;n = 922)、JU(波兰;n = 394)和TCGA-BRCA(美国;n = 131)获得了三个外部数据集。DL模型的独立评估:使用纽约大学兰贡训练数据子集,我们训练深度神经网络预测MRI检查中恶性肿瘤的概率。我们使用标准指标接收者操作特征曲线下面积(AUROC)和精确-召回曲线下面积(AUPRC)对模型进行了验证。该图展示了所有数据集的ROC曲线。读者研究:为了比较DL系统与专家的表现,五位读者和DL系统解读了100个随机MRI检查,并提供了他们对MRI检查中乳腺癌存在概率的预测。我们还通过将DL和放射科医生的预测平均化为一个“混合”预测来模拟结合DL和放射科医生的预测。DL在亚组中的表现:为了确认我们的模型在所有亚组中都表现良好,我们对模型在各个子集(就人口统计数据、影像特征和组织学特征而言)的表现进行了分析。网格子图展示了每个亚组(列)在四个指标(行)中DL模型的表现。详细结果在“亚组分析”部分呈现。个性化管理:我们模拟了一个场景,评估模型是否能正确识别BI-RADS 4病变的低风险患者,这些患者可能避免了不必要的活检(即,产生良性结果的活检)。这次模拟包括来自纽约大学数据集的956名患者,并使用了决策曲线分析(DCA)方法论。AI,人工智能;EHR,电子健康记录;FPR,假阳性率;TPR,真阳性率。
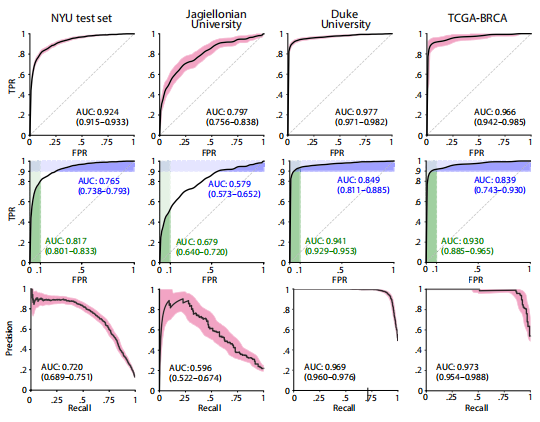
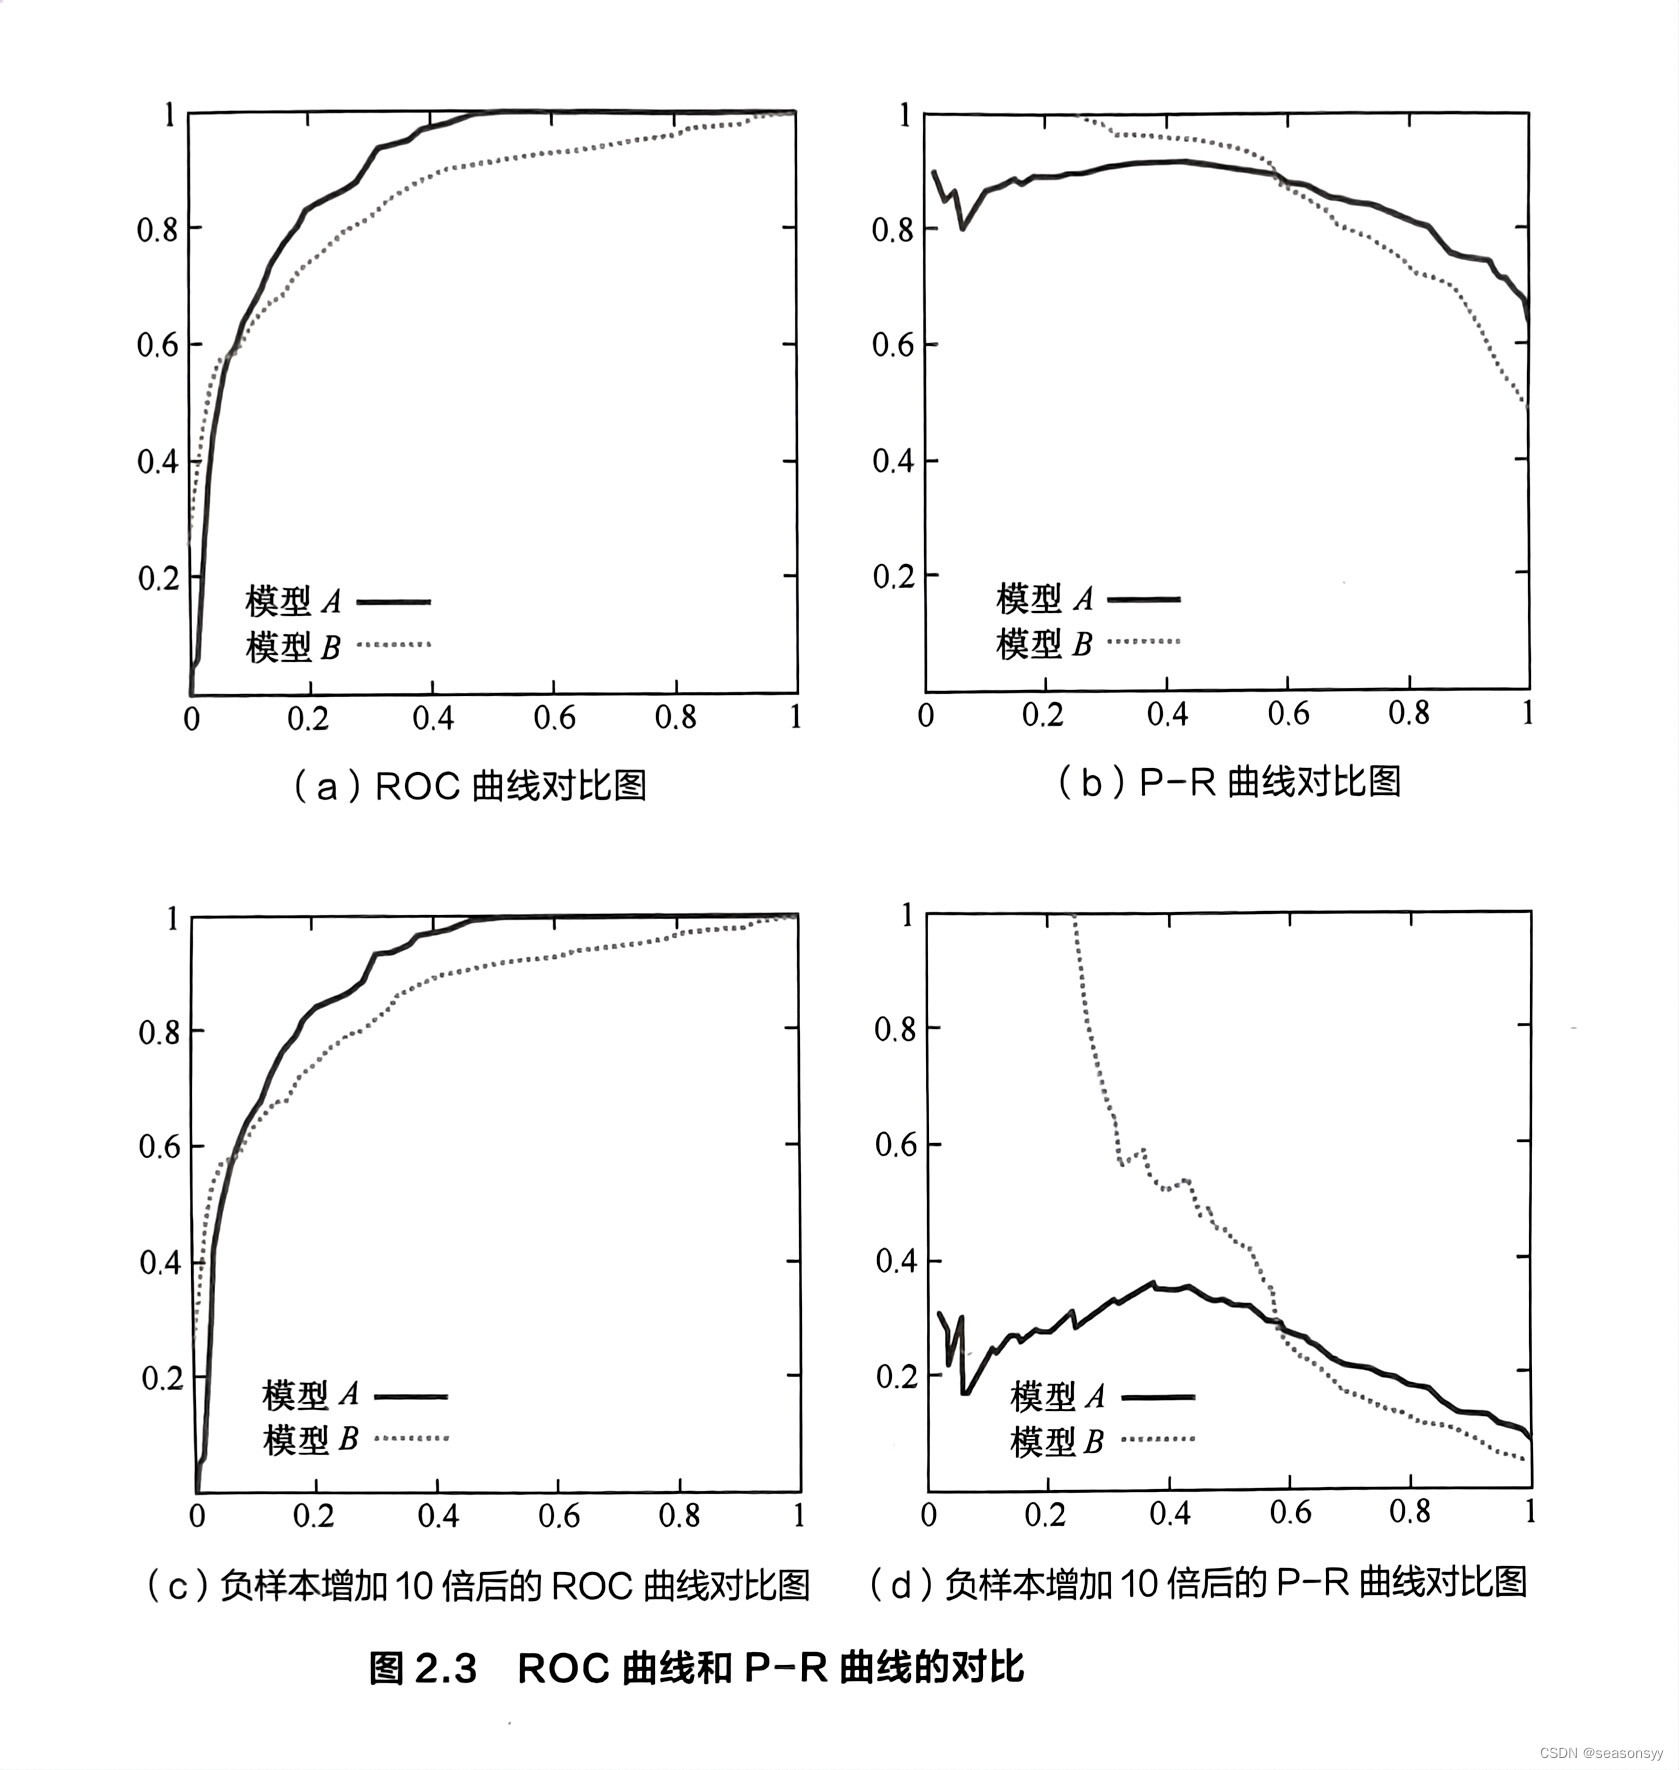
Fig. 2. DL system performance on all internal and external test sets. (Top) ROC curves with 95% CIs calculated with boot strapping. (Middle) ROC curves with partial AUC (pAUC). The AUCs in green represent the pAUC for specificity of 90 to 100%. The AUCs in blue represent the pAUC for sensitivity of 90 to 100%. (Bottom) PRCs with 95% CIs.
图 2. DL系统在所有内部和外部测试集上的性能。(上部)通过自助法计算的95%置信区间的ROC曲线。(中部)带有部分AUC(pAUC)的ROC曲线。绿色代表90至100%特异性的pAUC。蓝色代表90至100%敏感性的pAUC。(下部)带有95%置信区间的PRC曲线。
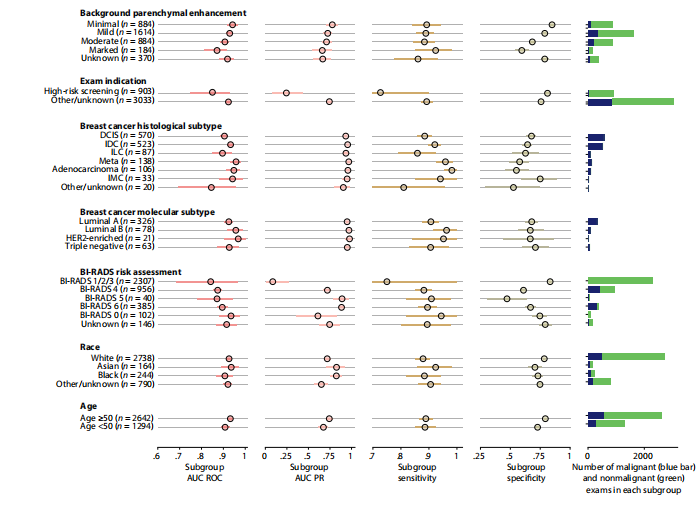
Fig. 3. System performance in key subgroups on the internal test set. Each subgroup was evaluated using four metrics: area under the receiver operating character istic curve (AUC ROC), area under the precision-recall curve (AUC PR), sensitivity, and specificity. Blue (malignant cases) and green (nonmalignant cases) bars to the right represent the number of examinations in each subgroup. Values for all subgroups and metrics are presented with 95% CIs calculated by bootstrap (N = 2000 replicates). To calculate the sensitivity and specificity, we selected a decision threshold such that the DL system’s sensitivity closely matches the average reader sensitivity. Full nu merical values for each subgroup are available in table S4. Examinations with BI-RADS categories 1, 2, and 3 were aggregated because there were no MRI exams associated with malignant diagnoses in BI-RADS 1 and 2 categories; thus, AUROC would be undefined in those subgroups. HER2, human epidermal growth factor receptor 2. DCIS, ductal carcinoma in situ; IDC, invasive ductal carcinoma; ILC, invasive lobular carcinoma; IMC, invasive mammary carcinoma.
图3. 系统在内部测试集的关键亚组中的性能。每个亚组使用四个指标进行评估:接收者操作特征曲线下的面积(AUC ROC)、精确度-召回曲线下的面积(AUC PR)、敏感性和特异性。右侧的蓝色(恶性病例)和绿色(非恶性病例)条形图代表每个亚组中的检查数量。所有亚组和指标的值均以通过自助法(N = 2000次重复)计算的95%置信区间呈现。为了计算敏感性和特异性,我们选择了一个决策阈值,使DL系统的敏感性与平均阅读者敏感性紧密匹配。每个亚组的完整数值可在表S4中找到。因为BI-RADS 1和2类别中没有与恶性诊断相关的MRI检查,所以将BI-RADS类别1、2和3聚合起来;因此,这些亚组的AUROC将是未定义的。HER2,人表皮生长因子受体2。DCIS,原位导管癌;IDC,浸润性导管癌;ILC,浸润性小叶癌;IMC,浸润性乳腺癌。
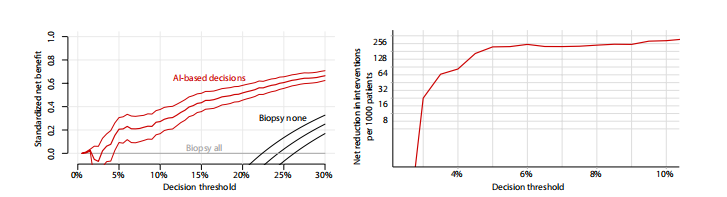
Fig. 4. Results of the DCA support using the DL system for making diagnostic decisions in low-risk patients with BI-RADS 4 lesions. (Left) Standardized net bene fit values (y axis) were higher when decisions are made based on the DL system’s predictions (red curve) compared to the default biopsy-all approach (gray curve at x = 0) across all relevant decision thresholds (x axis). The black curve is a biopsy-none approach. The net benefit curve is presented with 95% bootstrapped CIs (N = 2000 repli cates). (Right) Net interventions avoided per 1000 patients with BI-RADS 4 findings (y axis). Benefits were highest when decision threshold (x axis) was above 3%.
图 4. 使用DL系统在BI-RADS 4病变的低风险患者中进行诊断决策的DCA支持结果。(左侧)当决策基于DL系统的预测(红色曲线)而非默认的全体活检方法(灰色曲线在x = 0处)时,在所有相关决策阈值(x轴)上标准化净效益值(y轴)更高。黑色曲线是不进行任何活检的方法。净效益曲线呈现了95%自助法置信区间(N = 2000次复制)。(右侧)每1000名BI-RADS 4发现的患者避免的净干预次数(y轴)。当决策阈值(x轴)高于3%时,效益最高。
Table
表
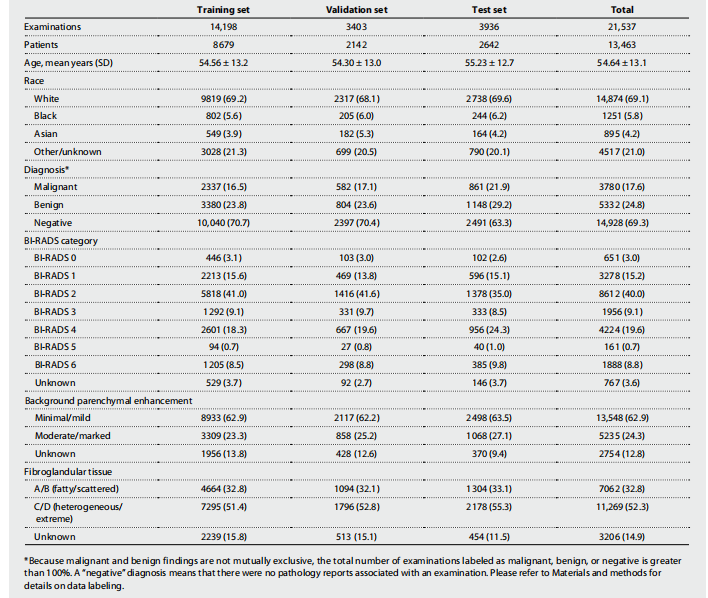
Table 1. NYU Langone dataset breakdown including demographic data and imaging characteristics. Values are n (%) unless specified otherwise. BI-RADS risk assessment categories, background parenchymal enhancement (BPE), and the amount of fibroglandular tissue are reported according to the American College of Radiology BI-RADS Atlas fifth edition (20). Breast-level diagnosis statistics are presented in table S7.
表1. 纽约大学兰贡数据集的细分,包括人口统计数据和影像特征。除非另有说明,否则值为 n(%)。BI-RADS风险评估类别、背景腺体增强(BPE)和纤维腺体组织的数量根据美国放射学会BI-RADS图谱第五版(20)报告。乳腺级别诊断统计数据在表S7中呈现。
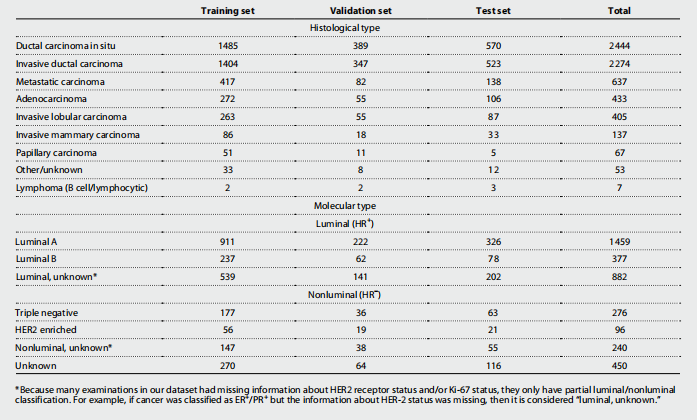
Table 2. Histological and molecular cancer subtypes. One patient and one imaging exam can have multiple findings. Values are n (% of all malignant cases), reported on an exam level. HR, hormone receptor; ER, estrogen receptor; PR, progesterone receptor; HER2, human epidermal growth factor receptor 2.
表2. 组织学和分子癌症亚型。一个患者和一次影像检查可以有多个发现。值为 n(所有恶性病例的百分比),在检查级别上报告。HR,激素受体;ER,雌激素受体;PR,孕酮受体;HER2,人表皮生长因子受体2。
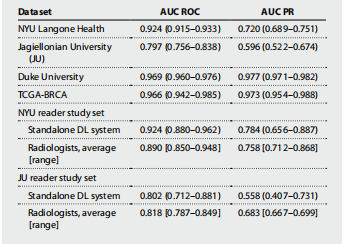
Table 3. Summary of the primary model performance. Results are presented with 95% CIs (bootstrapping with N = 2000 replicates), unless specified otherwise.
表3. 主要模型性能摘要。除非另有说明,否则结果以95%置信区间(通过N = 2000次重复的自助法)呈现。