【嵌入式——QT】QT Charts
概述
QT Charts模块是一组易于使用的图表组件,它基于Qt的Graphics View架构,其核心组件是QChartView和QChart,QChartView父类是QGraphicsView,就是Graphics View架构的视图组件,所以QChartView是用于显示图表的视图,要想使用Qt Charts模块,就要在.pro文件中引入 Qt += charts。
Qt提供的坐标轴类
- QValueAxis:数值坐标轴;
- QCategoryAxis:分组数值坐标轴;
- QLongValueAxis:对数数值坐标轴;
- QBarCategoryAxis:类别坐标轴;
- QDateTimeAxis:日期时间坐标轴;
QChart
QChart是组合图表各部件,显示各种数据序列的绘图组件。
QChart主要函数
- setTitle():设置图表标题;
- setTitleFont():设置图表标题字体;
- setTitleBrush():设置图表标题画刷;
- setTheme():设置主题;
- setMargins():设置绘图区与图表边界的4个边距;
- legend():返回图表的图例;
- setAnimationOptions():设置序列或坐标轴的动画效果;
- addSeries():添加序列;
- series():返回图表拥有的序列的列表;
- removeSeries():移除一个序列,但并不删除序列对象;
- removeAllSeries():移除并删除图表的所有序列;
- addAxis():为图表的某个方向添加坐标轴;
- axes():返回某个方向的坐标轴列表;
- setAxisX():设置某个序列的水平方向的坐标轴;
- setAxisY():设置某个序列的垂直方向的坐标轴;
- removeAxis():移除一个坐标轴;
- createDefaultAxes():根据已添加的序列的类型,创建缺省的坐标轴,前面已有的坐标轴会被删除;
QLineSeries
QLineSeries是用于绘制二维数据点的折线图。
QLineSeries类主要函数
- setName():设置序列的名称 ;
- chart():返回序列所属的图表对象 ;
- setVisible():设置序列可见性;
- show():显示序列;
- hide():隐藏序列 ;
- setColor():设置序列线条颜色 ;
- setPen():设置绘制线条的画笔 ;
- setBrush():设置绘制数据点的画刷 ;
- setPointsVisible():设置数据点可见性 ;
- append():添加一个数据点到序列;
- insert():在某个位置插入一个数据点 ;
- replace():替换某个数据点;
- clear():清空所有数据点 ;
- removePoints():从某个位置开始,删除指定个数的数据点;
- setPointLabelsVisible():设置数据点标签的可见性;
- setPointLabelsColor():设置数据点标签的文字颜色;
- setPointLabelsFont():设置数据点标签的字体;
- setPointLabelsFormat():设置数据点标签的格式;
QValueAxis
QValueAxis是数值坐标轴。
QValueAxis主要函数
- setVisible():设置坐标轴可见性;
- orientation():返回坐标轴方向;
- setMin():设置坐标轴最小值;
- setMax():设置坐标轴最大值;
- setTitleVisible():设置轴标题可见性;
- setRange():设置坐标轴最大、最小值范围 ;
- setTitleText():设置轴标题文字;
- setTitleFont():设置轴标题字体 ;
- setLabelFromat():设置标签格式 ;
- setLabelsBrush():设置标签的画刷;
- setLabelsColor():设置标签的颜色 ;
- setLabelsFont():设置标签的字体 ;
- setTickCount():设置坐标轴主刻度的个数 ;
- setLineVisible():设置轴线和刻度线的可见性;
- setLinePen():设置轴线和刻度线的画笔;
- setGridLineColor():设置网格线颜色 ;
- setGridLinePen():设置网格线画笔;
- setMinorTickCount():设置两个主刻度之间的次刻度的个数 ;
- setMinorGridLineColor():设置次网格线的颜色 ;
- setMinorGridLinePen():设置次网格线的画笔 ;
- setMinorGridLineVisible():设置次网格线的可见性;
常见图表及用到的序列类
- 柱状图:QBarSeries;
- 水平柱状图:QHorizontalBarSeries;
- 百分比柱状图:QPercentBarSeries;
- 水平百分比柱状图:QHorizontalBarSeries;
- 堆叠柱状图:QStackedBarSeries;
- 水平堆叠柱状图:QHorizontalBarSeries;
- 火柴盒图:QBoxPlotSeries;
- 饼图:QPieSeries;
- 折线图:QLineSeries;
- 光滑折线图:QSplineSeries;
- 散点图:QScatterSeries;
- 面积图:QAreaSeries;
这些类都是从QAbstractSeries类继承而来的。
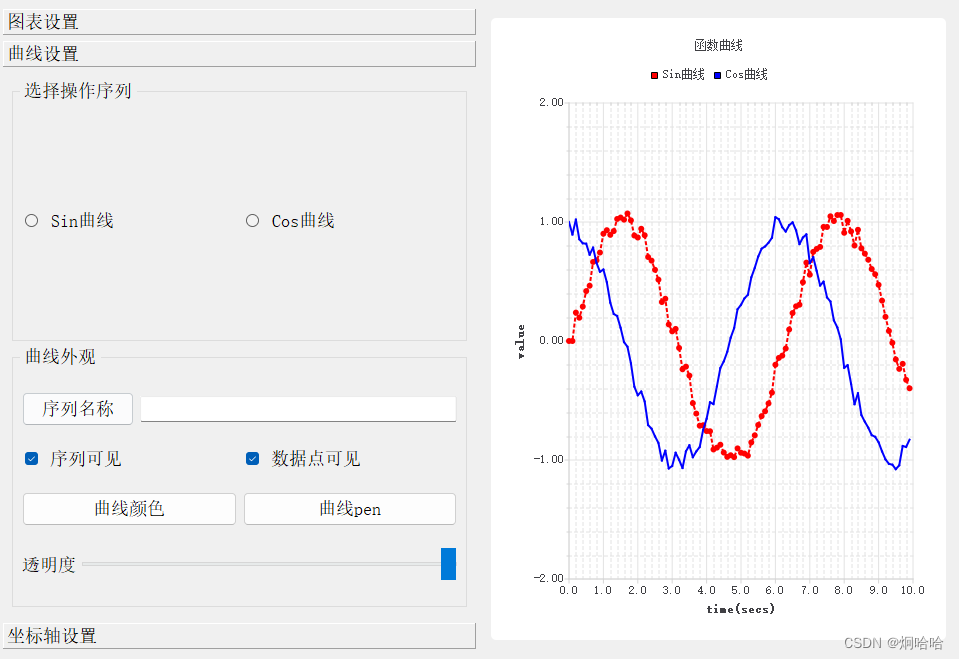
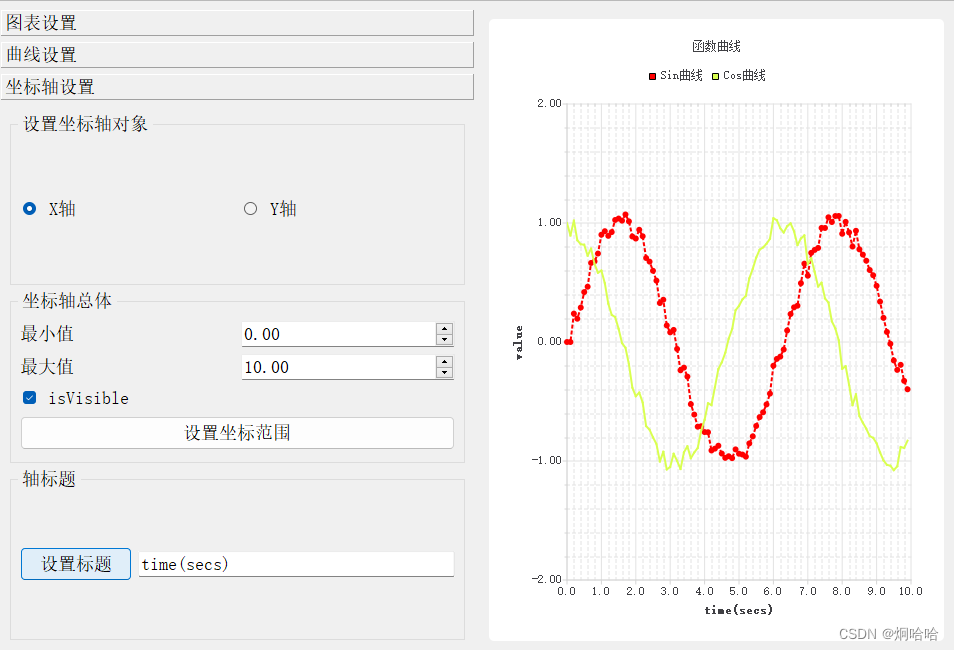
图示

代码示例
QChartMainWindow.h
#ifndef QCHARTMAINWINDOW_H
#define QCHARTMAINWINDOW_H

#include <QMainWindow>
#include <QtCharts>

namespace Ui
{
    class QChartMainWindow;
}

class QChartMainWindow : public QMainWindow
{
    Q_OBJECT

public:
    explicit QChartMainWindow(QWidget* parent = nullptr);
    ~QChartMainWindow();

    QLineSeries* curSeries;//当前序列
    QValueAxis* curAxis;//当前坐标轴

    void createChart();//创建图表
    void prepareData();//更新数据
    void updateFromChart();//从图表更新到界面

    void initUi();


private slots:
    void on_comboBox_currentIndexChanged(int index);

    void on_comboBox_2_currentIndexChanged(int index);

    void on_pushButton_3_clicked();

    void on_checkBox_6_stateChanged(int arg1);

    void on_checkBox_7_stateChanged(int arg1);

    void on_horizontalSlider_valueChanged(int value);

    void on_radioButton_clicked();

    void on_radioButton_2_clicked();

    void on_radioButton_3_clicked();

    void on_radioButton_4_clicked();

    void on_checkBox_2_stateChanged(int arg1);

    void on_radioButton_9_clicked();

    void on_radioButton_10_clicked();

    void on_checkBox_3_stateChanged(int arg1);

    void on_pushButton_clicked();

    void on_pushButton_2_clicked();

    void on_pushButton_6_clicked();

    void on_pushButton_7_clicked();

    void on_pushButton_8_clicked();

    void on_radioButtonX_clicked();

    void on_radioButtonY_clicked();

    void on_pushButtonRange_clicked();

    void on_pushButton_5_clicked();

private:
    Ui::QChartMainWindow* ui;

    QChart* chart;

    QLineSeries* series0;
    QLineSeries* series1;
};

#endif // QCHARTMAINWINDOW_H
QChartMainWindow.cpp
#include "QChartMainWindow.h"
#include "ui_QChartMainWindow.h"
#include <QTime>
#include <QFontDialog>
#include <QColorDialog>
QChartMainWindow::QChartMainWindow(QWidget* parent)
    : QMainWindow(parent)
    , ui(new Ui::QChartMainWindow)
{
    ui->setupUi(this);
    createChart();
    prepareData();
    updateFromChart();
    initUi();
}

QChartMainWindow::~QChartMainWindow()
{
    delete ui;
}

void QChartMainWindow::createChart()
{
    chart = new QChart();
    chart->setTitle(u8"函数曲线");
    ui->graphicsView->setChart(chart);
    ui->graphicsView->setRenderHint(QPainter::Antialiasing);
    ui->graphicsView->chart()->legend()->setAlignment(Qt::AlignTop);
    //创建折线序列
    series0 = new QLineSeries();
    series1 = new QLineSeries();
    series0->setName(u8"Sin曲线");
    series1->setName(u8"Cos曲线");
    curSeries = series0;
    QPen pen;
    pen.setStyle(Qt::DotLine);
    pen.setWidth(2);
    pen.setColor(Qt::red);
    series0->setPen(pen);
    pen.setStyle(Qt::SolidLine);
    pen.setColor(Qt::blue);
    series1->setPen(pen);
    chart->addSeries(series0);
    chart->addSeries(series1);
    //数值坐标轴 X轴
    QValueAxis* axisX = new QValueAxis;
    curAxis = axisX;
    axisX->setRange(0, 10);
    axisX->setLabelFormat("%.1f");
    axisX->setTickCount(11);
    axisX->setMinorTickCount(4);
    axisX->setTitleText("time(secs)");
    //数值坐标轴 Y轴
    QValueAxis* axisY = new QValueAxis;
    axisY->setRange(-2, 2);
    axisY->setLabelFormat("%.2f");
    axisY->setTickCount(5);
    axisY->setMinorTickCount(4);
    axisY->setTitleText("value");
    chart->setAxisX(axisX, series0);
    chart->setAxisX(axisX, series1);
    chart->setAxisY(axisY, series0);
    chart->setAxisY(axisY, series1);
}

//填充数据
void QChartMainWindow::prepareData()
{
    QLineSeries* series0 = (QLineSeries*)ui->graphicsView->chart()->series().at(0);
    QLineSeries* series1 = (QLineSeries*)ui->graphicsView->chart()->series().at(1);
    series0->clear();
    series1->clear();
    qsrand(QTime::currentTime().second());
    qreal t=0, y1, y2, intv=0.1;
    qreal rd;
    int cnt = 100;
    for(int i=0; i<cnt; i++) {
        rd=(qrand()%10)-5;
        y1 = qSin(t)+rd/50;
        series0->append(t, y1);
        y2=qCos(t)+rd/50;
        series1->append(t, y2);
        t+=intv;
    }
}

void QChartMainWindow::updateFromChart()
{
    QChart* aChart = ui->graphicsView->chart();
    ui->lineEditTitle->setText(aChart->title());
    QMargins mg = aChart->margins();
    ui->spinBox->setValue(mg.left());
    ui->spinBox_2->setValue(mg.right());
    ui->spinBox_3->setValue(mg.top());
    ui->spinBox_4->setValue(mg.bottom());
}

void QChartMainWindow::initUi()
{
    ui->comboBox->addItem("NoAnimation", 0);
    ui->comboBox->addItem("GridAxisAnimations", 1);
    ui->comboBox->addItem("SeriesAnimations", 2);
    ui->comboBox->addItem("AllAnimations", 3);
    ui->comboBox_2->addItem("ChartThemeLight", 0);
    ui->comboBox_2->addItem("ChartThemeBlueCerulean", 1);
    ui->comboBox_2->addItem("ChartThemeDark", 2);
    ui->comboBox_2->addItem("ChartThemeBrownSand", 3);
    ui->comboBox_2->addItem("ChartThemeBlueNcs", 4);
    ui->comboBox_2->addItem("ChartThemeHighContrast", 5);
    ui->comboBox_2->addItem("ChartThemeBlueIcy", 6);
    ui->comboBox_2->addItem("ChartThemeQt", 7);
    ui->checkBox_7->setCheckState(Qt::Checked);
    ui->checkBox_6->setCheckState(Qt::Checked);
    ui->checkBox_2->setCheckState(Qt::Checked);
    ui->checkBox_3->setCheckState(Qt::Checked);
    ui->radioButton->setChecked(true);
    ui->horizontalSlider->setRange(0, 100);
    ui->horizontalSlider->setValue(100);
}

void QChartMainWindow::on_comboBox_currentIndexChanged(int index)
{
    switch(index) {
        case 0:
            chart->setAnimationOptions(QChart::NoAnimation);
            break;
        case 1:
            chart->setAnimationOptions(QChart::GridAxisAnimations);
            break;
        case 2:
            chart->setAnimationOptions(QChart::SeriesAnimations);
            break;
        case 3:
            chart->setAnimationOptions(QChart::AllAnimations);
            break;
    }
}


void QChartMainWindow::on_comboBox_2_currentIndexChanged(int index)
{
    switch(index) {
        case 0:
            chart->setTheme(QChart::ChartThemeLight);
            break;
        case 1:
            chart->setTheme(QChart::ChartThemeBlueCerulean);
            break;
        case 2:
            chart->setTheme(QChart::ChartThemeDark);
            break;
        case 3:
            chart->setTheme(QChart::ChartThemeBrownSand);
            break;
        case 4:
            chart->setTheme(QChart::ChartThemeBlueNcs);
            break;
        case 5:
            chart->setTheme(QChart::ChartThemeHighContrast);
            break;
        case 6:
            chart->setTheme(QChart::ChartThemeBlueIcy);
            break;
        case 7:
            chart->setTheme(QChart::ChartThemeQt);
            break;
    }
}


void QChartMainWindow::on_pushButton_3_clicked()
{
    bool ok = false;
    QFont font = QFontDialog::getFont(&ok);
    if(ok) {
        ui->graphicsView->chart()->legend()->setFont(font);
    }
}


void QChartMainWindow::on_checkBox_6_stateChanged(int arg1)
{
    if(arg1 ==2) {
        curSeries->setVisible(true);
    } else {
        curSeries->setVisible(false);
    }
}


void QChartMainWindow::on_checkBox_7_stateChanged(int arg1)
{
    if(arg1 ==2) {
        curSeries->setPointsVisible(true);
    } else {
        curSeries->setPointsVisible(false);
    }
}


void QChartMainWindow::on_horizontalSlider_valueChanged(int value)
{
    curSeries->setOpacity(value);
}


void QChartMainWindow::on_radioButton_clicked()
{
    ui->graphicsView->chart()->legend()->setAlignment(Qt::AlignTop);
}


void QChartMainWindow::on_radioButton_2_clicked()
{
    ui->graphicsView->chart()->legend()->setAlignment(Qt::AlignBottom);
}


void QChartMainWindow::on_radioButton_3_clicked()
{
    ui->graphicsView->chart()->legend()->setAlignment(Qt::AlignLeft);
}


void QChartMainWindow::on_radioButton_4_clicked()
{
    ui->graphicsView->chart()->legend()->setAlignment(Qt::AlignRight);
}


void QChartMainWindow::on_checkBox_2_stateChanged(int arg1)
{
    if(arg1 == 2) {
        ui->graphicsView->chart()->legend()->setVisible(true);
    } else {
        ui->graphicsView->chart()->legend()->setVisible(false);
    }
}


void QChartMainWindow::on_radioButton_9_clicked()
{
    curSeries=series0;
}


void QChartMainWindow::on_radioButton_10_clicked()
{
    curSeries=series1;
}


void QChartMainWindow::on_checkBox_3_stateChanged(int arg1)
{
    if(arg1 == 2) {
        ui->graphicsView->chart()->legend()->backgroundVisibleChanged(true);
    } else {
        ui->graphicsView->chart()->legend()->backgroundVisibleChanged(false);
    }
}


void QChartMainWindow::on_pushButton_clicked()
{
    chart->setTitle(ui->lineEdit->text());
}


void QChartMainWindow::on_pushButton_2_clicked()
{
    bool ok = false;
    QFont font = QFontDialog::getFont(&ok);
    if(ok) {
        ui->graphicsView->chart()->setTitleFont(font);
    }
}


void QChartMainWindow::on_pushButton_6_clicked()
{
    ui->lineEdit_2->setText(curSeries->name());
}


void QChartMainWindow::on_pushButton_7_clicked()
{
    QColor color = QColorDialog::getColor(curSeries->color(), this, u8"选择颜色");
    if(color.isValid()) {
        curSeries->setColor(color);
    }
}


void QChartMainWindow::on_pushButton_8_clicked()
{
    //TODO 曲线pen
}


void QChartMainWindow::on_radioButtonX_clicked()
{
    curAxis = (QValueAxis*)ui->graphicsView->chart()->axisX();
    ui->doubleSpinBoxMin->setValue(curAxis->min());
    ui->doubleSpinBoxMax->setValue(curAxis->max());
    ui->lineEditTitle->setText(curAxis->titleText());
    ui->checkBox->setChecked(curAxis->isTitleVisible());
}


void QChartMainWindow::on_radioButtonY_clicked()
{
    curAxis = (QValueAxis*)ui->graphicsView->chart()->axisY();
    ui->doubleSpinBoxMin->setValue(curAxis->min());
    ui->doubleSpinBoxMax->setValue(curAxis->max());
    ui->lineEditTitle->setText(curAxis->titleText());
    ui->checkBox->setChecked(curAxis->isTitleVisible());
}


void QChartMainWindow::on_pushButtonRange_clicked()
{
    curAxis->setRange(ui->doubleSpinBoxMin->text().toDouble(), ui->doubleSpinBoxMax->text().toDouble());
}


void QChartMainWindow::on_pushButton_5_clicked()
{
    QColor color = QColorDialog::getColor(curSeries->color(), this, u8"选择颜色");
    if(color.isValid()) {
        ui->graphicsView->chart()->legend()->setLabelColor(color);
    }
}