一、环境说明
- Promethues Web网页地址:
http://:9090 (替换为实际的 Prometheus 服务器IP和端口) - Grafana Web网页地址:
http://:3000 (替换为实际的 Grafana 服务器IP和端口) - Exporter(例如:Kafka Exporter)Web网页地址:
http://: (替换为实际的 Exporter IP和端口) - 监控部署服务器地址:
http://<监控服务器IP> (替换为部署监控系统的服务器IP)
二、Grafana 规则配置
Grafana 告警规则通常在 Grafana Dashboard 中设置:
1、登录 Grafana。
2、选择或创建一个 Dashboard。
3、为面板添加以下规则
Dashboard Name:
Dashboard Rules:
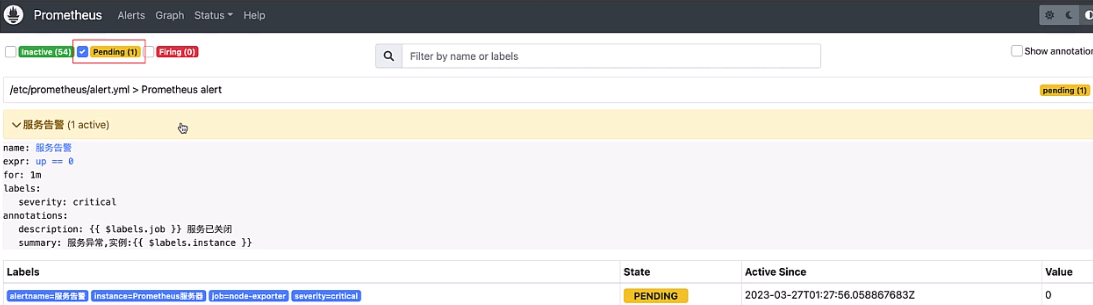
三、AlertManager 规则配置
AlertManager 用于管理 Prometheus 发送的告警。配置 AlertManager 规则通常包括定义接收者、路由和通知方式:
yaml
route:
receiver: ‘team-X-mails’
receivers:
- name: ‘team-X-mails’
email_configs:- to: ‘team-x@yourcompany.com’
inhibit_rules:
- source_match:
severity: ‘critical’
target_match:
severity: ‘warning’
equal: [‘alertname’, ‘dev’, ‘instance’]
将以上配置添加到 AlertManager 的配置文件中。
请注意,这些配置示例需要根据您的实际环境和需求进行调整。确保在应用任何更改之前对配置进行适当的测试和验证。
![[<span style='color:red;'>Grafana</span>]ES数据源<span style='color:red;'>Alert</span><span style='color:red;'>告警</span>发送](https://img-blog.csdnimg.cn/direct/4626bdaf30774b38b9c98c9d846bbbdf.png)


![[ECE] 5–7 Troubleshooting-1](https://img-blog.csdnimg.cn/direct/cbd24f6799354f8482a7ced7241c559d.png)