一、概述
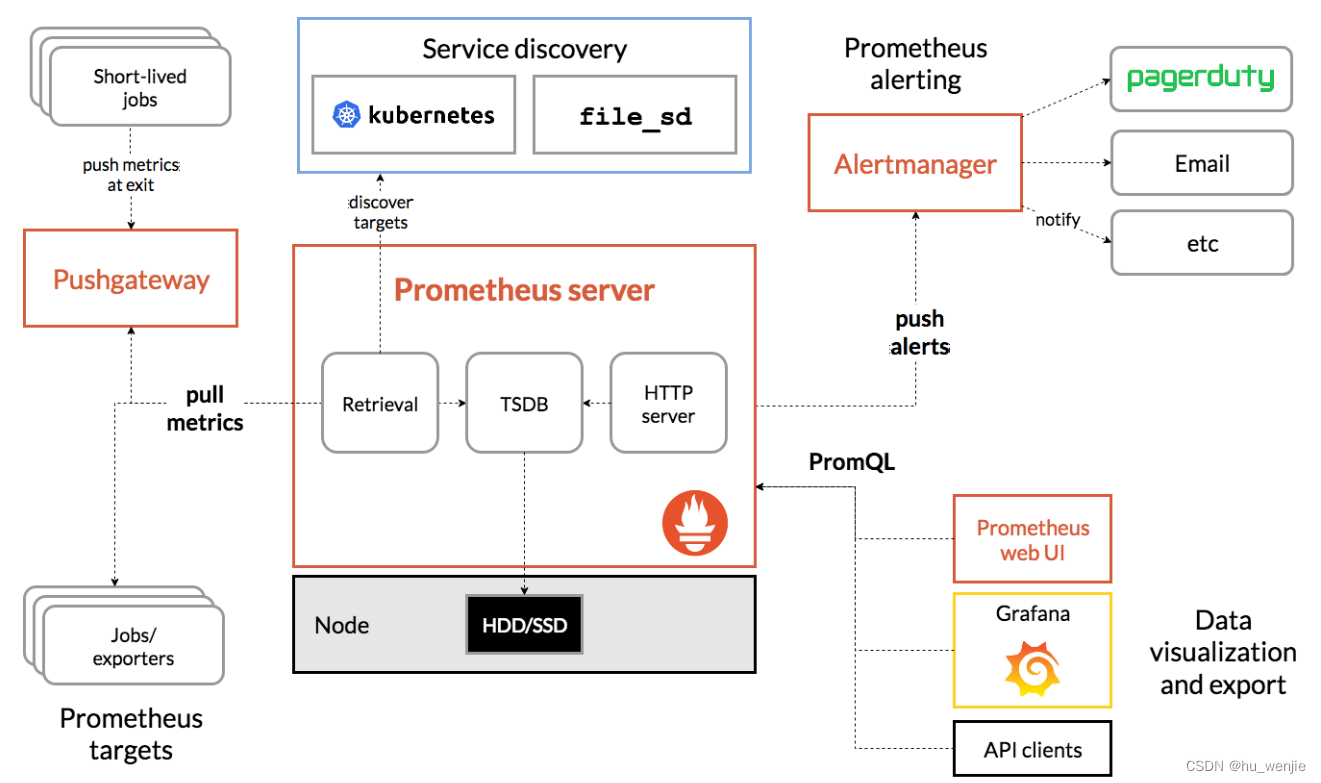
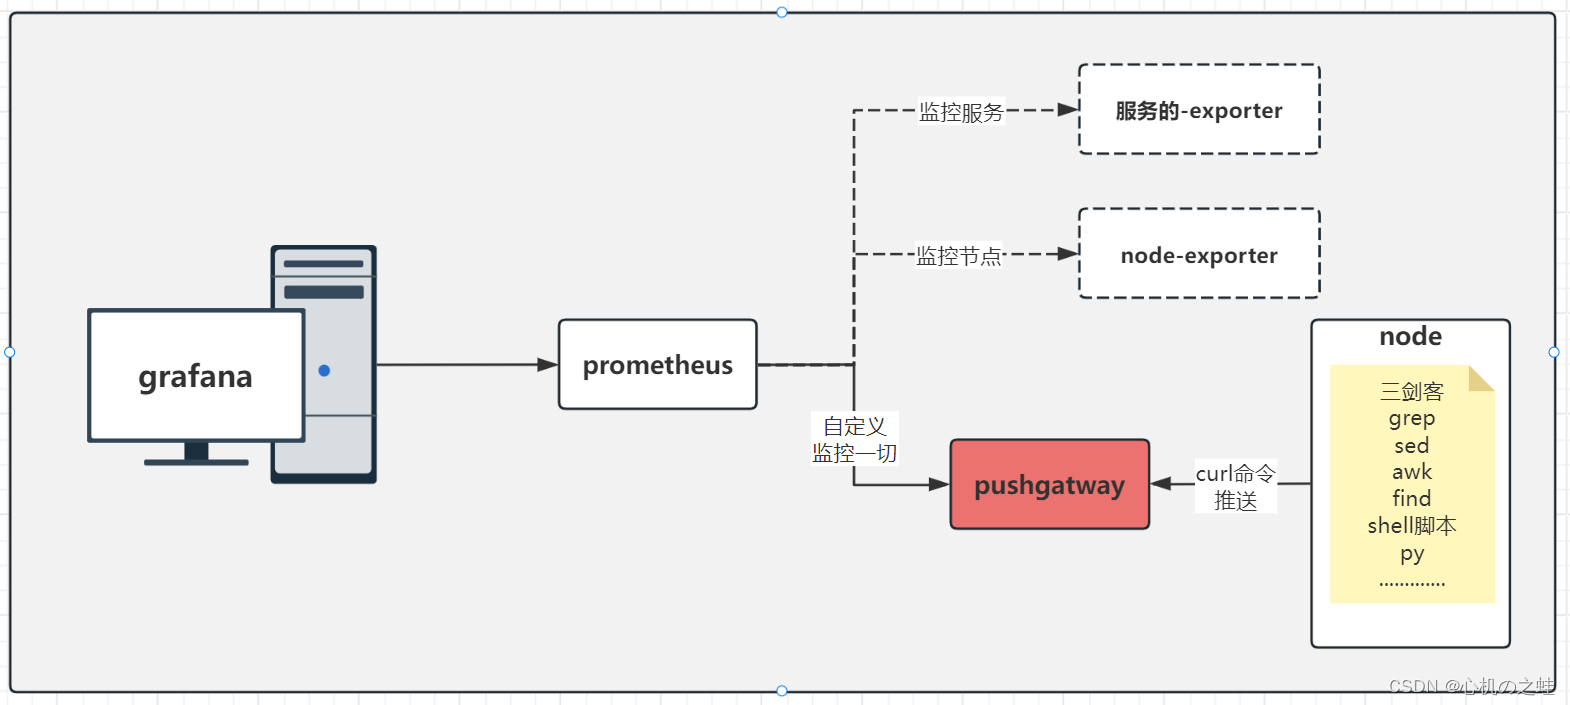
pushgateway用于自定义监控节点、节点中服务的工具,用户可以通过自定义的命令获取数据,并将数据推送给pushgateway中;
prometheus服务,从pushgateway中获取监控数据;
二、部署pushgateway
我们可以“随便”找一台机器,作为pushgatway的服务端,用来接收数据;
本次学习,为了方便,我们使用
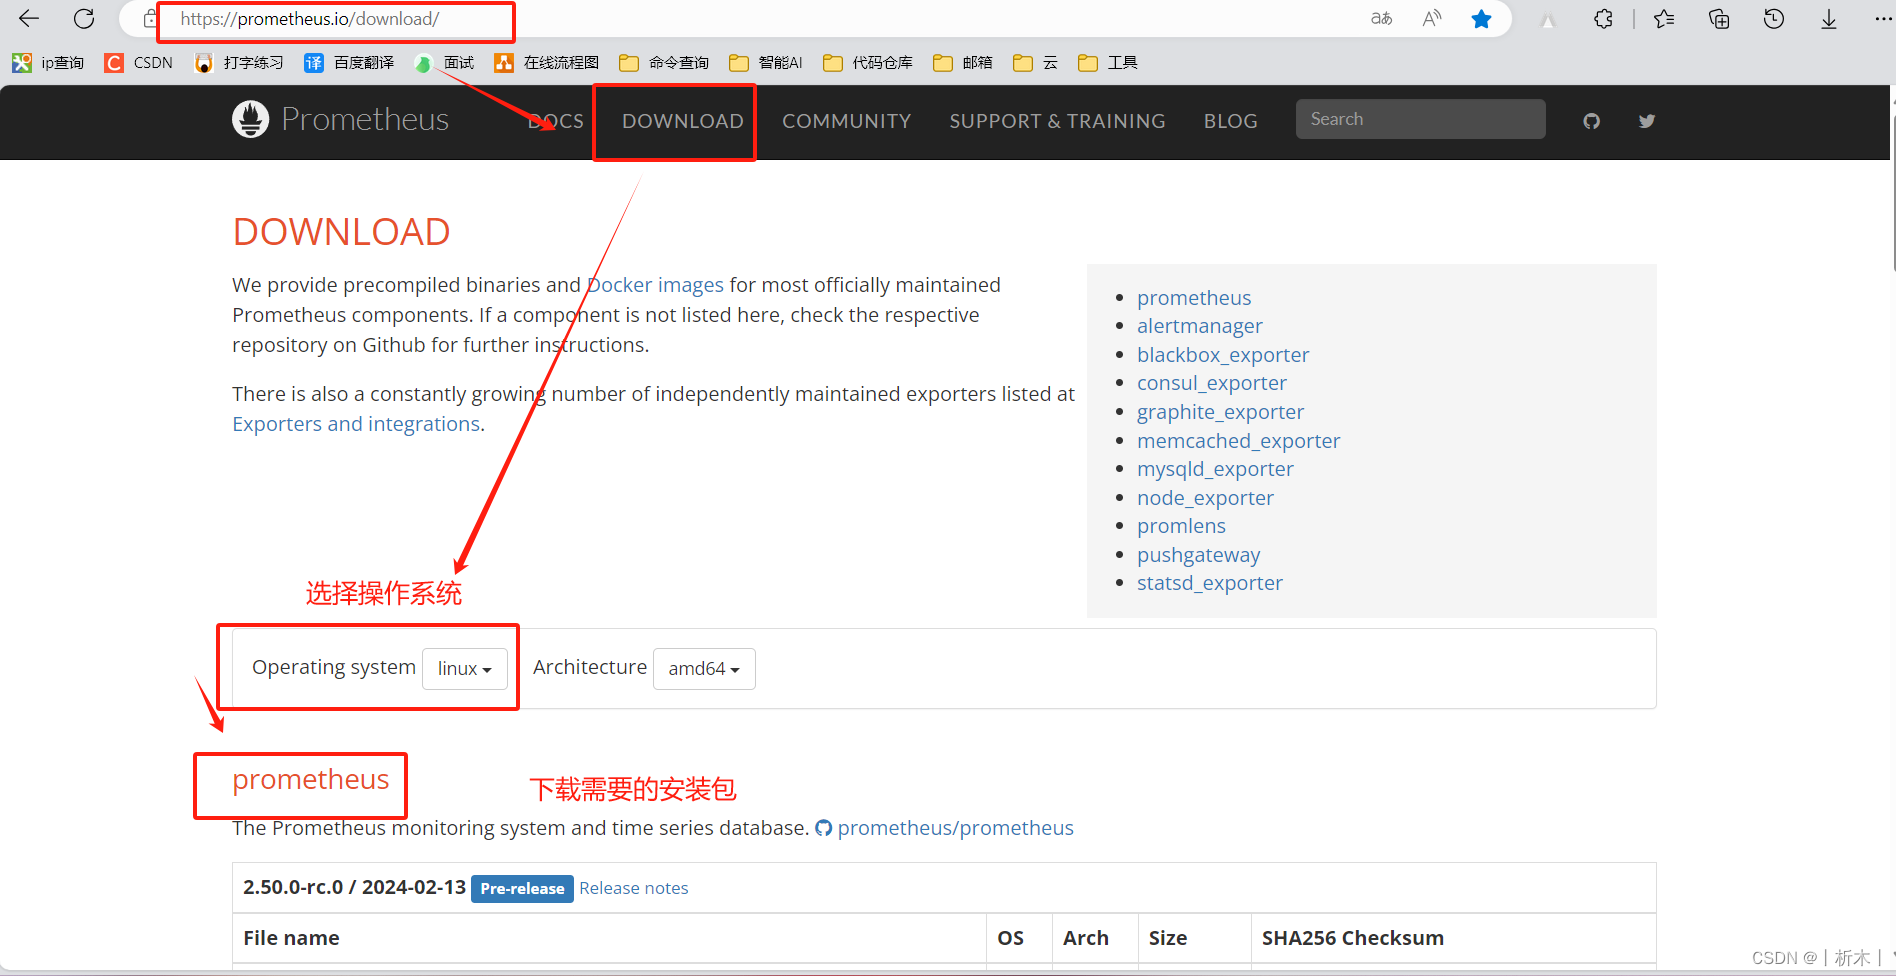
1,软件包下载地址
pushgateway下载地址:
wget https://github.com/prometheus/pushgateway/releases/download/v1.6.1/pushgateway-1.6.1.linux-amd64.tar.gz
本次学习,为了方便,给大家准备了软件包,在本站蜘蛛
链接:https://pan.baidu.com/s/1QFwCNrkIFJMZ-uIjiqfNog?pwd=21ui
提取码:21ui
2,上传解压软件包
[root@prometheus-server32 ~]# tar xf pushgateway-1.6.1.linux-amd64.tar.gz -C /usr/local/bin/ pushgateway-1.6.1.linux-amd64/pushgateway --strip-components=1
3,编辑配置systenctl启动文件
[root@prometheus-server32 ~]# cat > /etc/systemd/system/pushgatway.service <<EOF
> [Unit]
> Description=Pushgateway
> After=network.target
>
> [Service]
> ExecStart=/usr/local/bin/pushgateway \
> --web.listen-address=:9091 \
> --persistence.file=/prometheus/data/pushgatway.log \
> --persistence.interval=5m \
> --log.level=info \
> --log.format=json
>
> [Install]
> WantedBy=multi-user.target
> EOF
4,创建日志目录
[root@prometheus-server32 ~]# mkdir -pv /prometheus/data/
5,重新加载并启动
systemctl daemon-reload
systemctl enable --now pushgatway
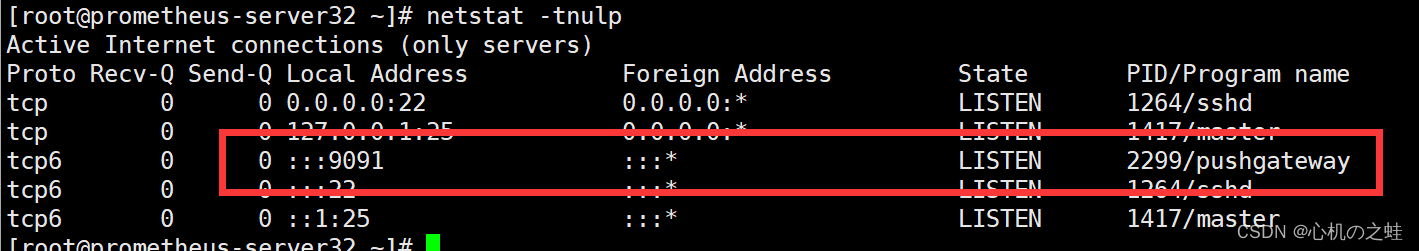
6,浏览器访问webui

查看端口是否启动成功
三、配置prometheus抓取pushgateway数据
[root@prometheus-server31 ~]# vim /prometheus/softwares/prometheus-2.37.8.linux-amd64/prometheus.yml
global:
scrape_interval: 3s
evaluation_interval: 15s
alerting:
alertmanagers:
- static_configs:
- targets:
# - alertmanager:9093
rule_files:
# - "first_rules.yml"
# - "second_rules.yml"
scrape_configs:
- job_name: "prometheus-pushgateway"
#如果pushgateway组件的标签,和prometheus服务的标签冲突了,如何解决?
#1,false(默认),将标签加上前缀“exporter_”,不覆盖;
#2,true,覆盖原来的标签;
honor_labels: true
static_configs:
- targets: ["10.0.0.32:9091"]
[root@prometheus-server31 ~]# curl -X POST http://10.0.0.31:9090/-/reload
浏览器查看,prometheus抓取pushgatway数据联通了,但是还没有数据;

四、被监控服务推送数据到pushgateway
[root@prometheus-node41 ~]# echo "user_num 22" | curl --data-binary @- http://10.0.0.32:9091/metrics/job/xinjizhiwa_user/instance/10.0.0.41
参数说明
echo "key value" | curl --data-binary @- http://pushgatway的ip:端口号/metrics/job/自定义job名称/instance/被监控节点的ip地址
pushgateway浏览器查看是否推送成功

prometheus浏览器查看是否抓取到数据
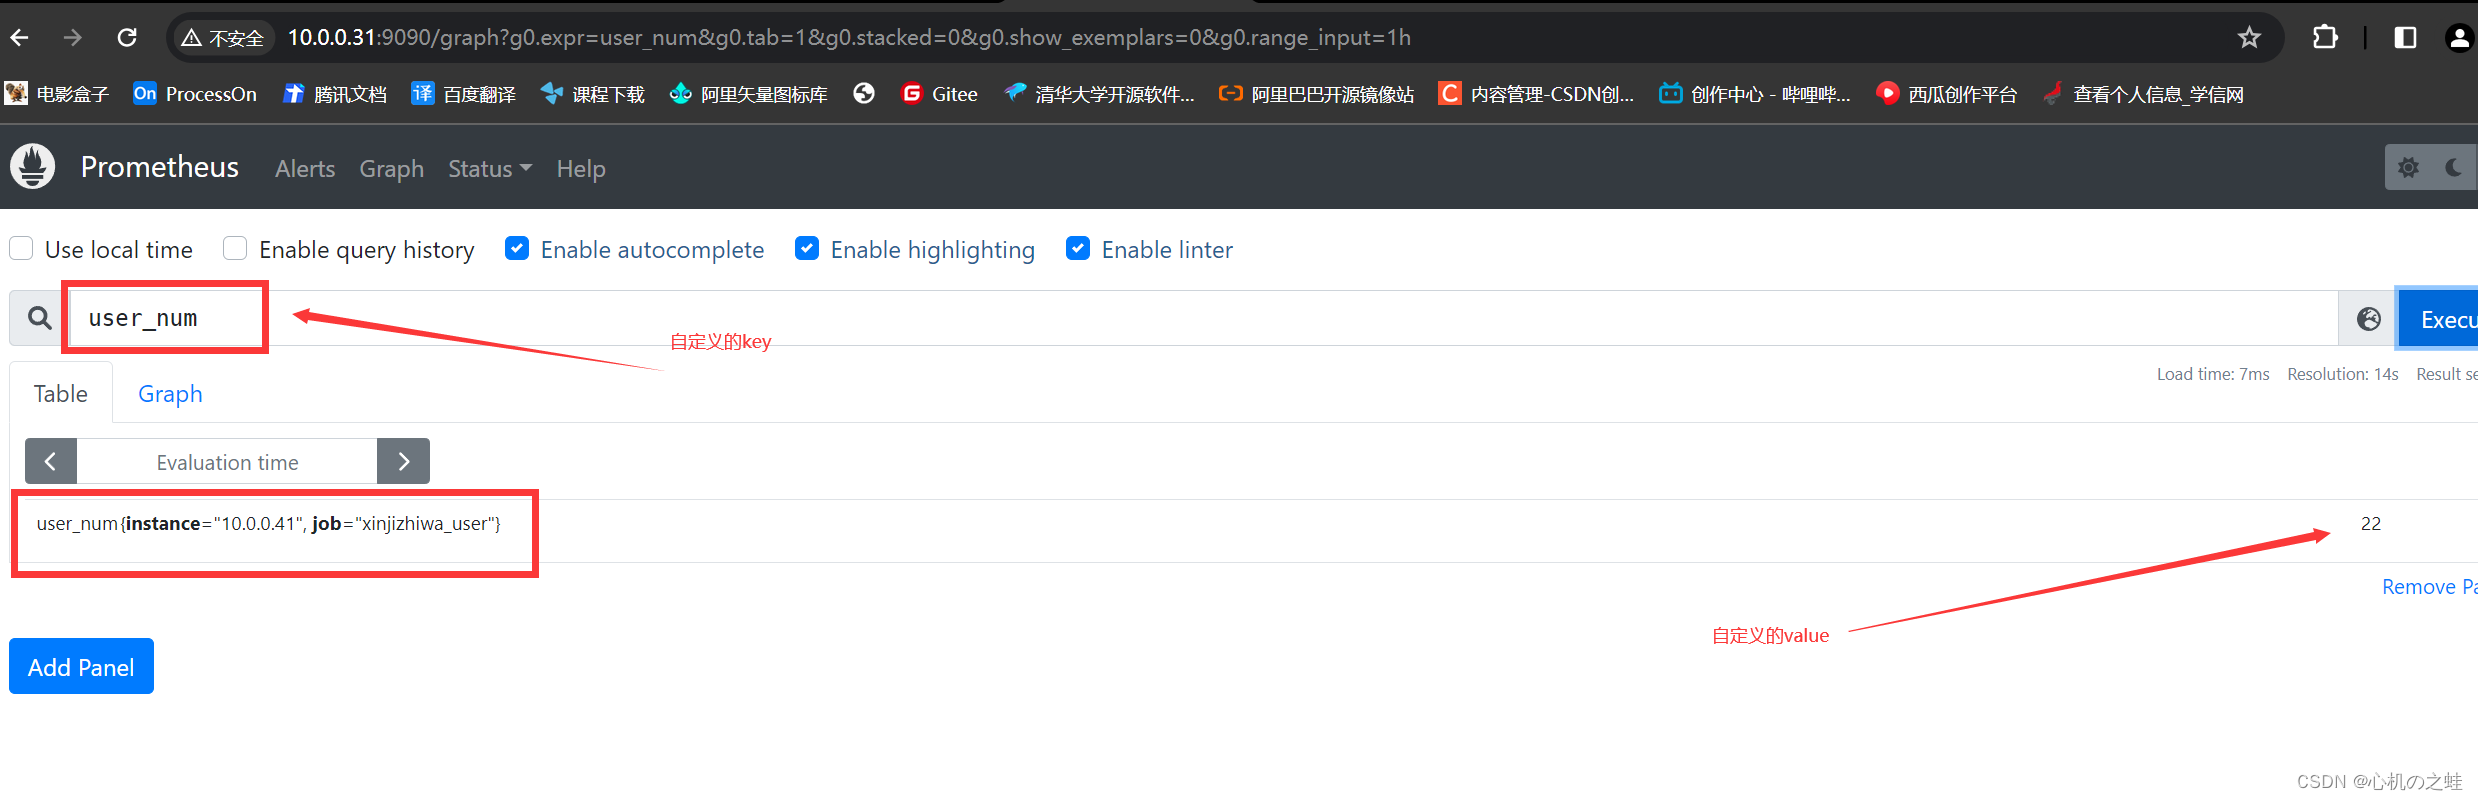
至此,配置完成;自定义监控成功;
至此,pushgatway自定义监控,学习完毕。