RQT:模块化可视化工具
ROS中的Rviz功能已经很强大了,不过有些场景下,我们可能更需要一些简单的模块化的可视化工具,比如只显示一个摄像头的图像,使用Rviz的话,难免会觉得操作有点麻烦。
此时,我们就会用到ROS提供的另外一种模块化可视化工具——rqt。
rqt介绍
正如RQT的命名,它和Rviz一样,也是基于QT可视化工具开发而来,在使用前,我们需要通过这样一句指令进行安装,然后就可以通过rqt这个命令启动使用了。
安装
注意自己ros2 的版本,我的是humble
sudo apt install ros-humble-rqt
启动
rqt
启动成功后如图
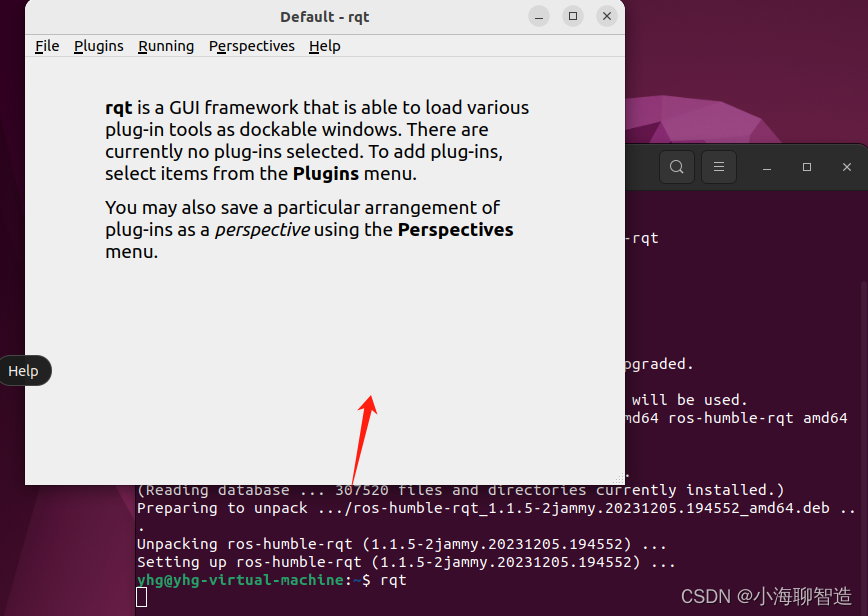
里边可以加载很多小模块,每个模块都可以实现一个具体的小功能,一些常用的功能如下:

日志显示:

也可以通过命令行方式启动
ros2 run rqt_console rqt_console
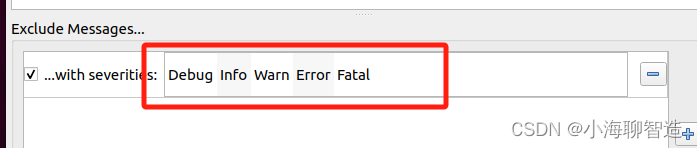
从启动的界面可以看到有三个部分
Console:
The first section of the console is where log messages from your system will display.
Exclude Message:
In the middle you have the option to filter messages by excluding severity levels. You can also add more exclusion filters using the plus-sign button to the right.
用来过滤日志等级的
Hightlight Message…:
The bottom section is for highlighting messages that include a string you input. You can add more filters to this section as well.
自定义过滤
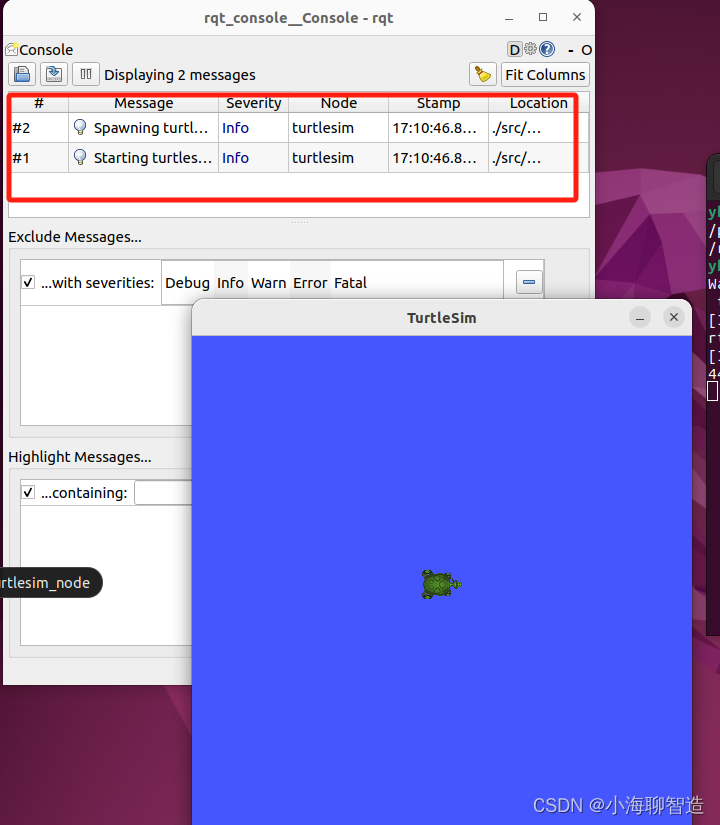
现在我们新开命令窗口,启动一个小乌龟节点
Now start turtlesim in a new terminal with the following command:
ros2 run turtlesim turtlesim_node
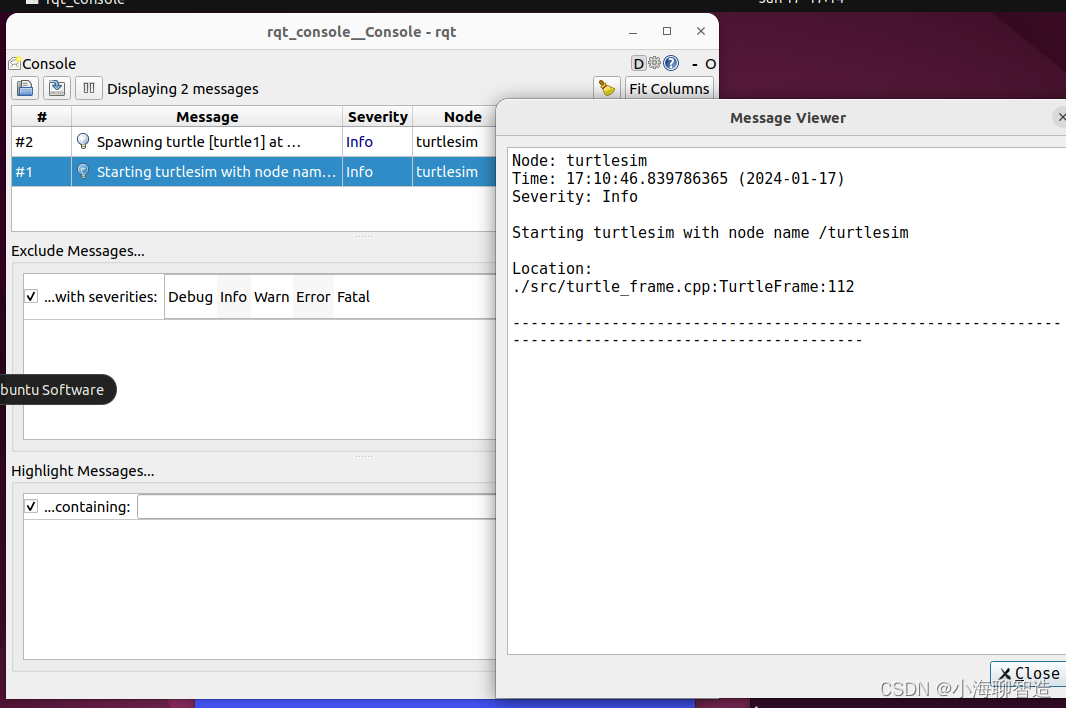
启动成功后我们会发现Console 栏中就会多两行数据,如下图所示:
双击某行日志可查看详情信息
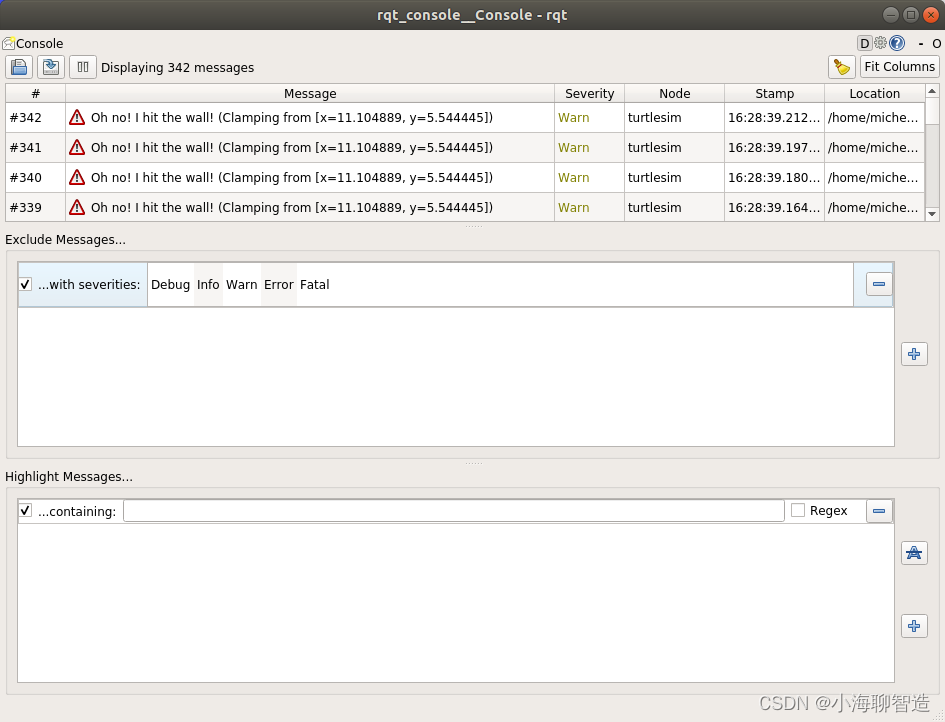
测试定义一个不同级别日志的消息
To produce log messages for rqt_console to display, let’s have the turtle run into the wall. In a new terminal, enter the ros2 topic pub command (discussed in detail in the topics tutorial) below:
发布一条让小龟一直往前走的消息
ros2 topic pub -r 1 /turtle1/cmd_vel geometry_msgs/msg/Twist "{linear: {x: 2.0, y: 0.0, z: 0.0}, angular: {x: 0.0,y: 0.0,z: 0.0}}"
Since the above command is publishing the topic at a steady rate, the turtle is continuously running into the wall. In rqt_console you will see the same message with the Warn severity level displayed over and over, like so:
设置默认的日志等级
Set the default logger level
You can set the default logger level when you first run the /turtlesim node using remapping. Enter the following command in your terminal:
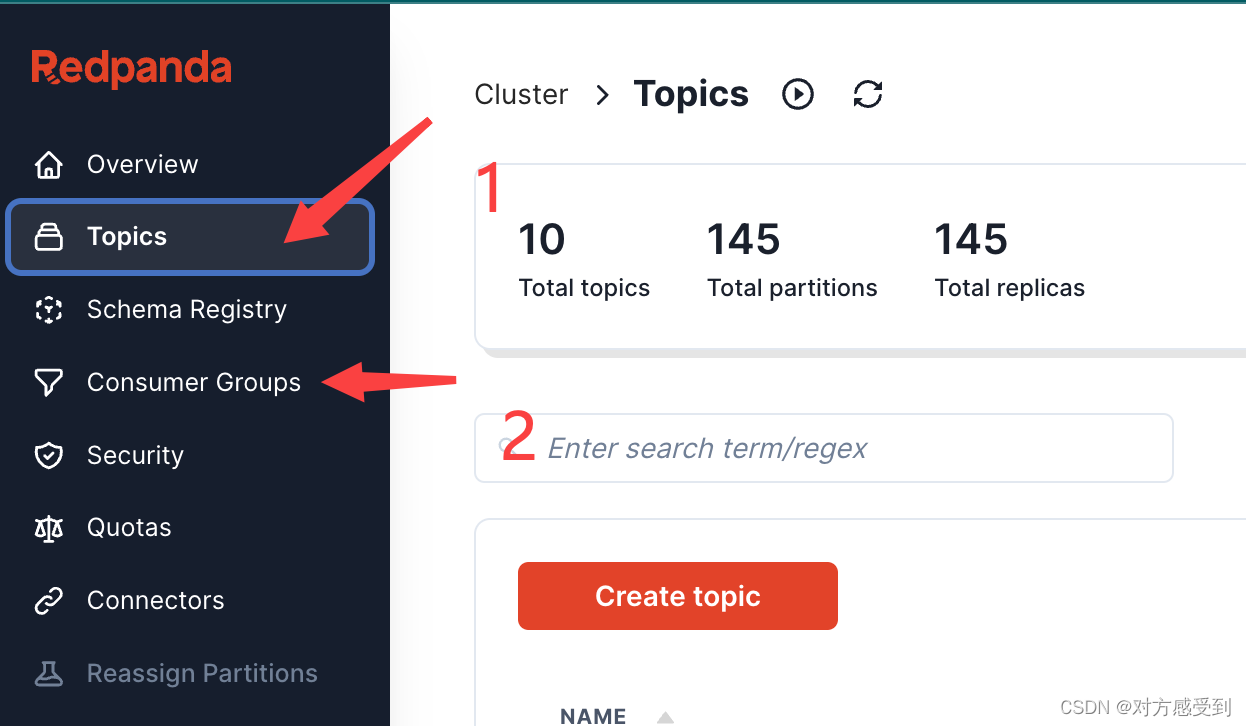
查看当前所有的topic 列表
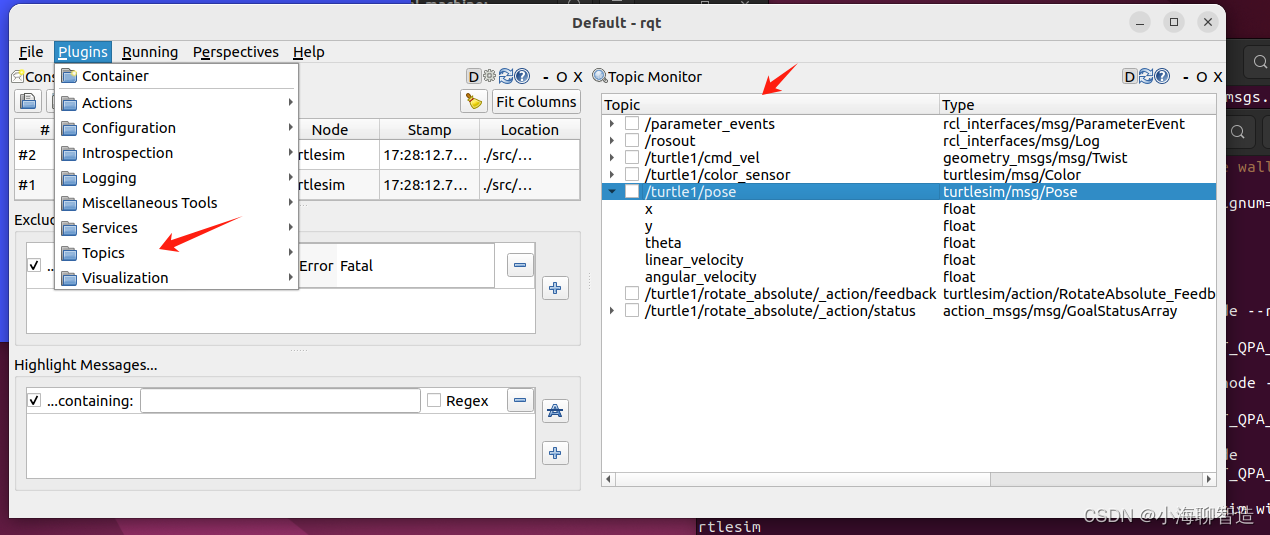
发布话题数据/调用服务请求

数据包管理

节点可视化
Introspection / Node Graph
第一个是肯定是rqt_graph,插件名字叫做Node Graph,这个名字小鱼觉得更加的贴切,用rqt_graph更多的是为了延续ROS1中的用法,这个插件用于查看节点和节点之间的关系的。

查看节点和节点之间的关系

启动 Service 服务
从顶部的菜单栏中选择Plugins > Services > Service Caller

刷新服务列表
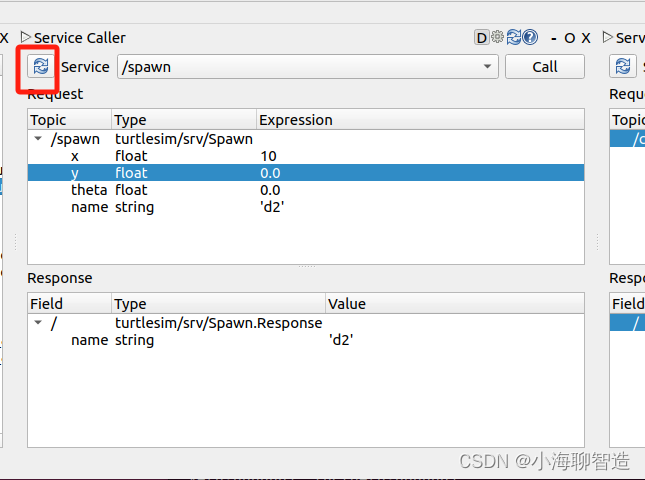
调整调用服务的参数

启动服务

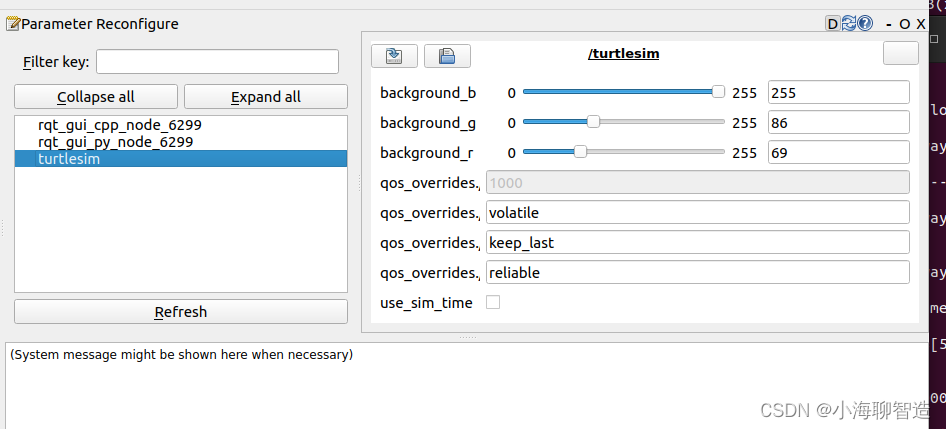
查看设置节点服务的参数

RQT还有好些个插件的应用,后面会慢慢的补充
参考链接:
https://docs.ros.org/en/humble/Concepts/About-RQt.html
https://docs.ros.org/en/humble/Tutorials/Beginner-CLI-Tools/Using-Rqt-Console/Using-Rqt-Console.html
![[<span style='color:red;'>ROS</span> 系列<span style='color:red;'>学习</span>教程] <span style='color:red;'>rqt</span><span style='color:red;'>可</span><span style='color:red;'>视</span><span style='color:red;'>化</span><span style='color:red;'>工具箱</span> - Topic<span style='color:red;'>工具</span>](https://img-blog.csdnimg.cn/direct/b61045e6110c4a5a822bd3ef7cbdfb1c.png#pic_center)