1.添加图例:
import matplotlib.pyplot as plt

# 准备数据
x = [1, 2, 3, 4, 5]
y1 = [2, 4, 6, 8, 10]
y2 = [1, 3, 5, 7, 9]

# 创建折线图并设置标签
plt.plot(x, y1, label='Line 1')
plt.plot(x, y2, label='Line 2')

# 添加图例
plt.legend()

# 添加标题和标签
plt.title("折线图示例")
plt.xlabel("X轴")
plt.ylabel("Y轴")

# 显示图形
plt.show()
在上述示例中,通过在调用plot()函数时设置label参数来给每条线条指定一个标签,然后通过plt.legend()添加图例。
2.添加注释:
import matplotlib.pyplot as plt

# 准备数据
x = [1, 2, 3, 4, 5]
y = [2, 4, 6, 8, 10]

# 创建折线图
plt.plot(x, y)

# 添加注释
plt.annotate('Max Value', xy=(x[y.index(max(y))], max(y)), xytext=(3, 8),
             arrowprops=dict(facecolor='black', arrowstyle='->'))

# 添加标题和标签
plt.title("折线图示例")
plt.xlabel("X轴")
plt.ylabel("Y轴")

# 显示图形
plt.show()
在上述示例中,通过plt.annotate()函数添加注释。xy参数指定注释位置的坐标,xytext参数指定注释文本的位置坐标,arrowprops参数可以设置注释箭头的样式。
以上示例展示了如何使用Matplotlib添加图例和注释。你可以根据需要设置不同的参数来自定义图例和注释的外观。
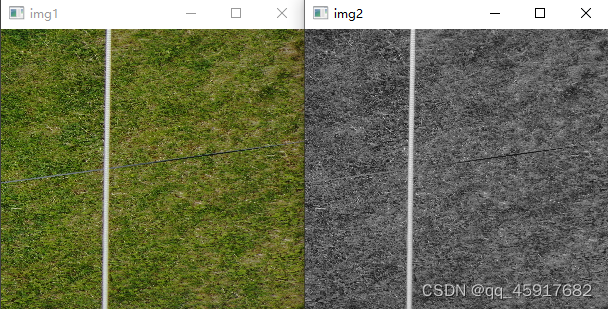


![XCTF:What-is-this[WriteUP]](https://img-blog.csdnimg.cn/direct/2b3ece2ecc6e452e89ff5e96178be3fb.png)