1.Grafana介绍
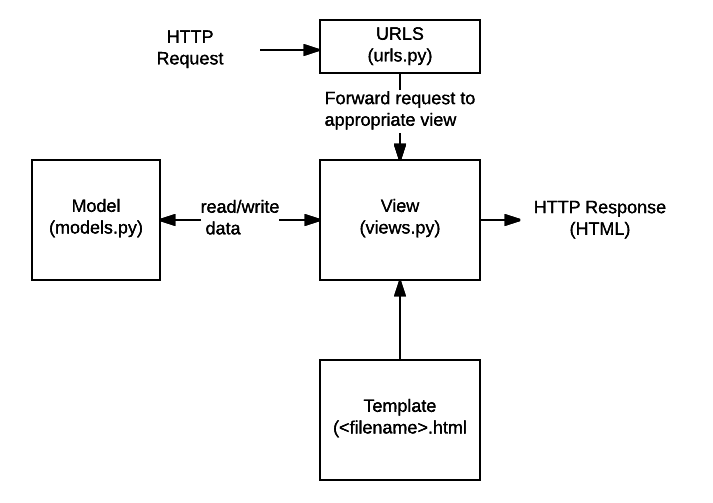
grafana 是一款采用Go语言编写的开源应用,主要用于大规模指标数据的可视化展现,是网络架构和应用分析中最流行的时序数据展示工具,目前已经支持绝大部分常用的时序数据库。
Grafana下载地址:https://grafana.com/grafana/download
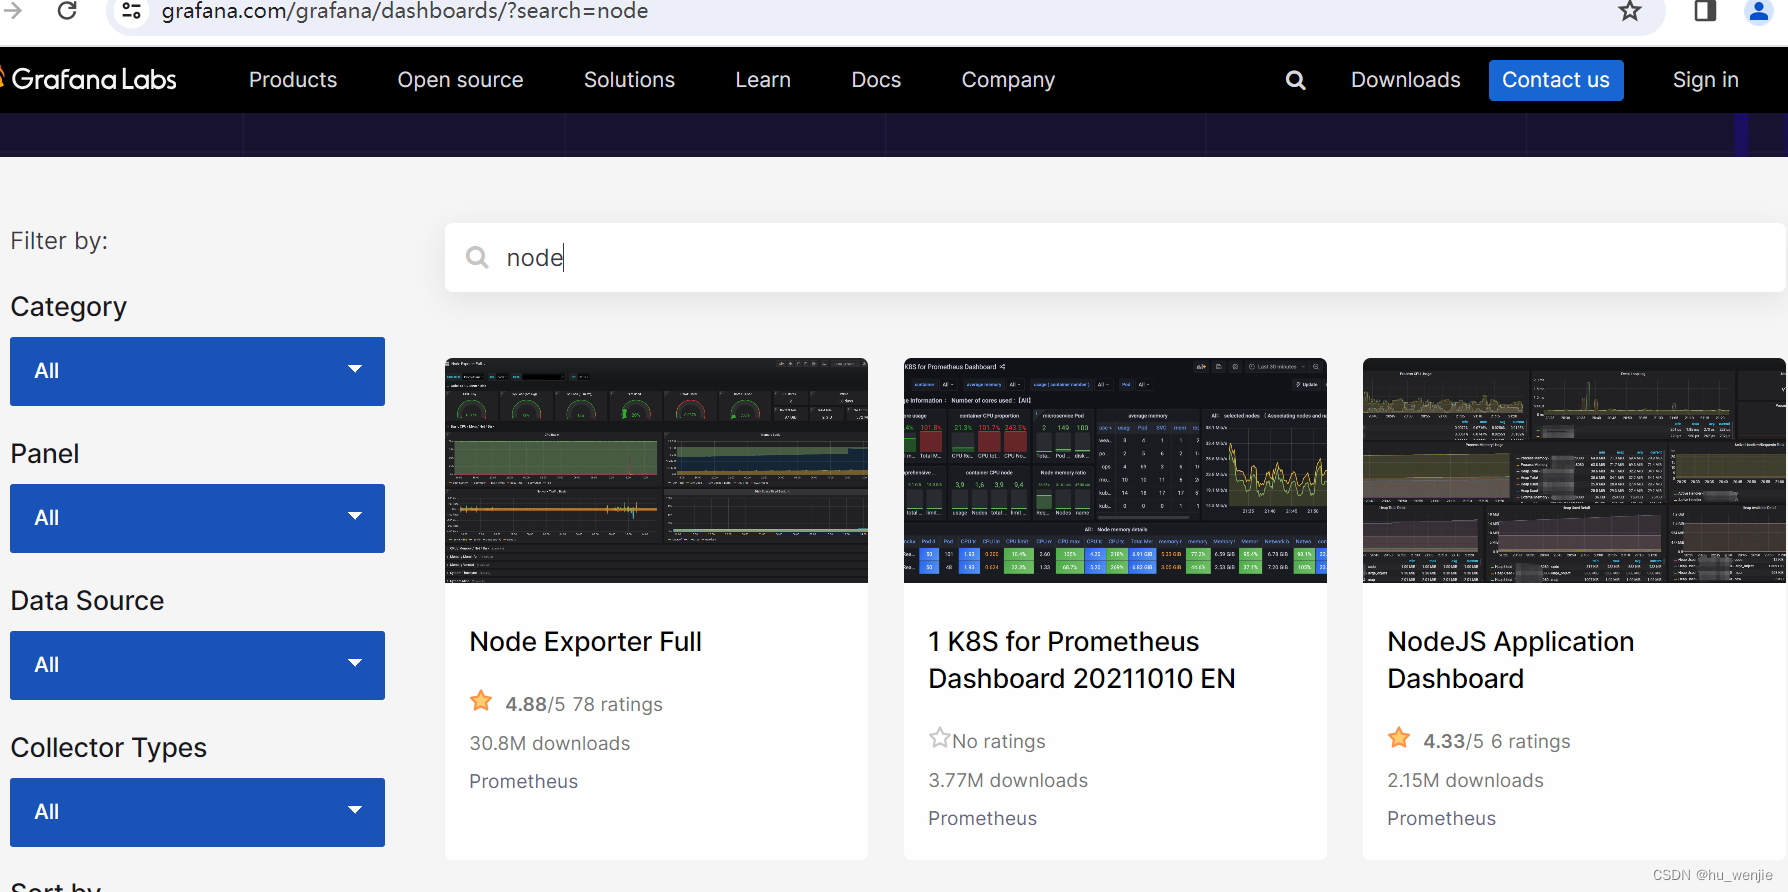
Grafana仪表盘模板下载地址:https://grafana.com/grafana/dashboards/
2.Grafana配置Prometheus仪表盘
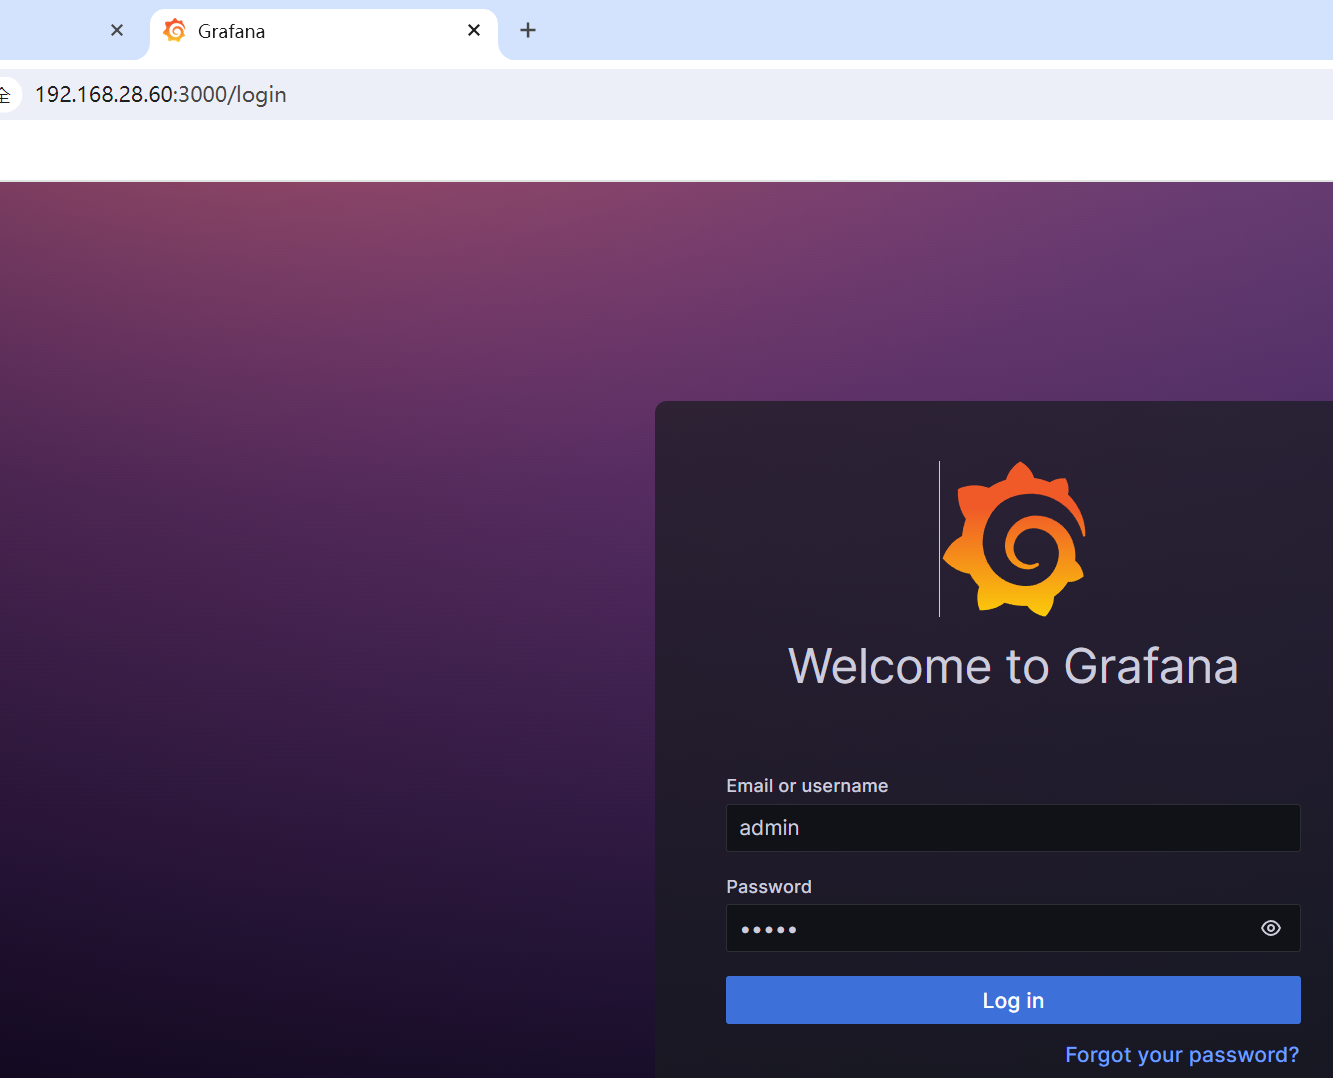
2.1安装Grafana
查看官网安装配置
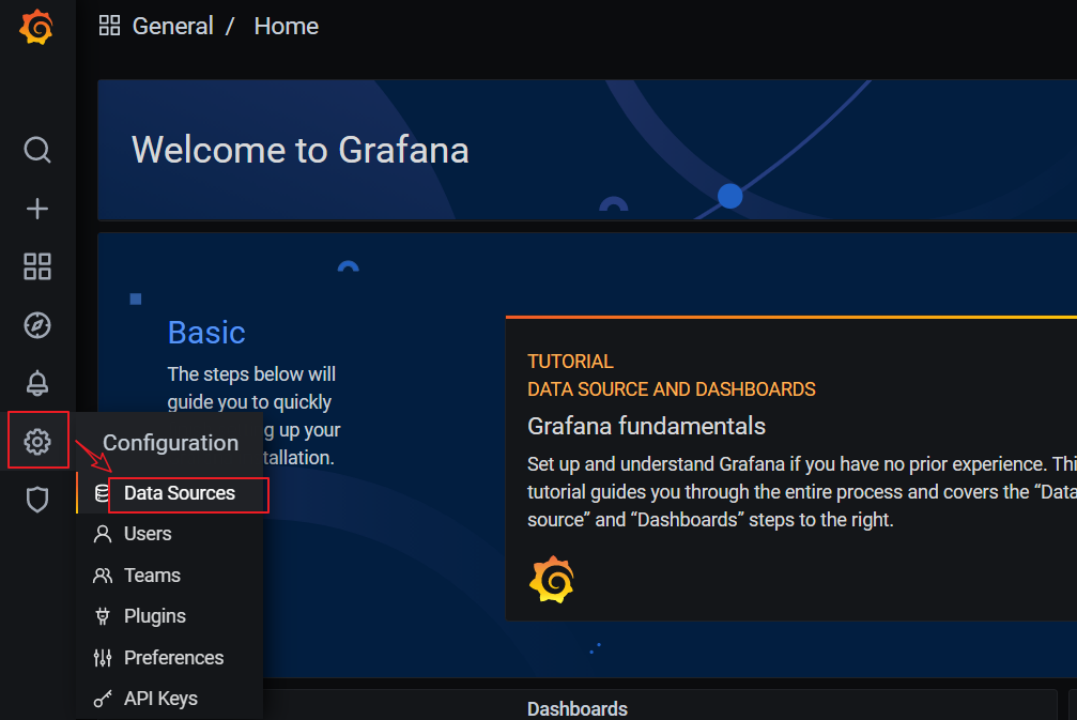
2.2添加数据源Prometheus
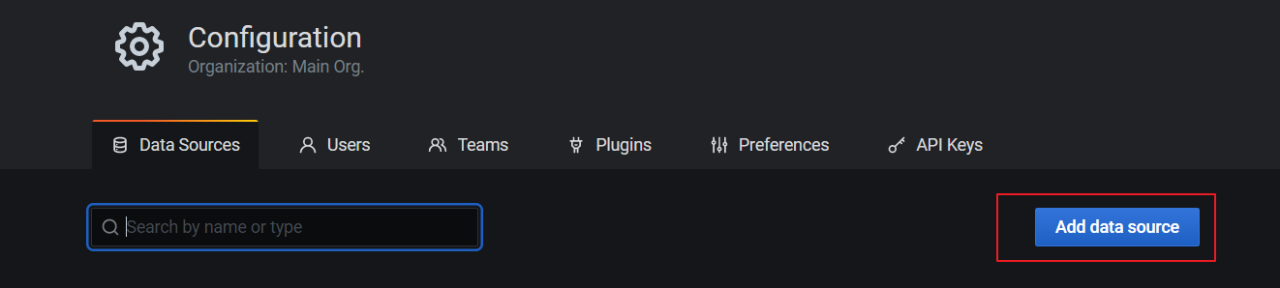
点击配置,点击Data Sources:
点击添加按钮:
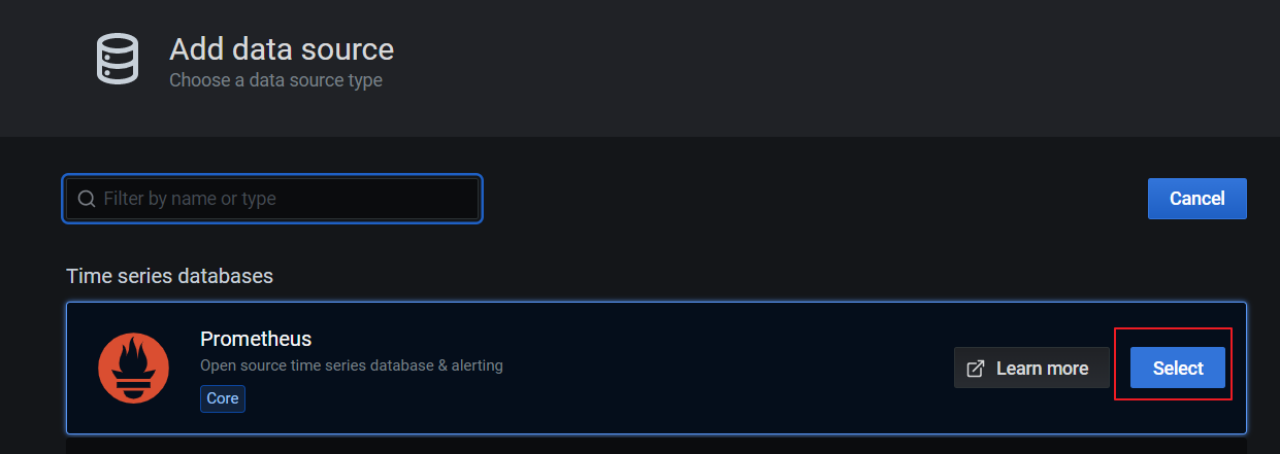
找到Prometheus,点击Select
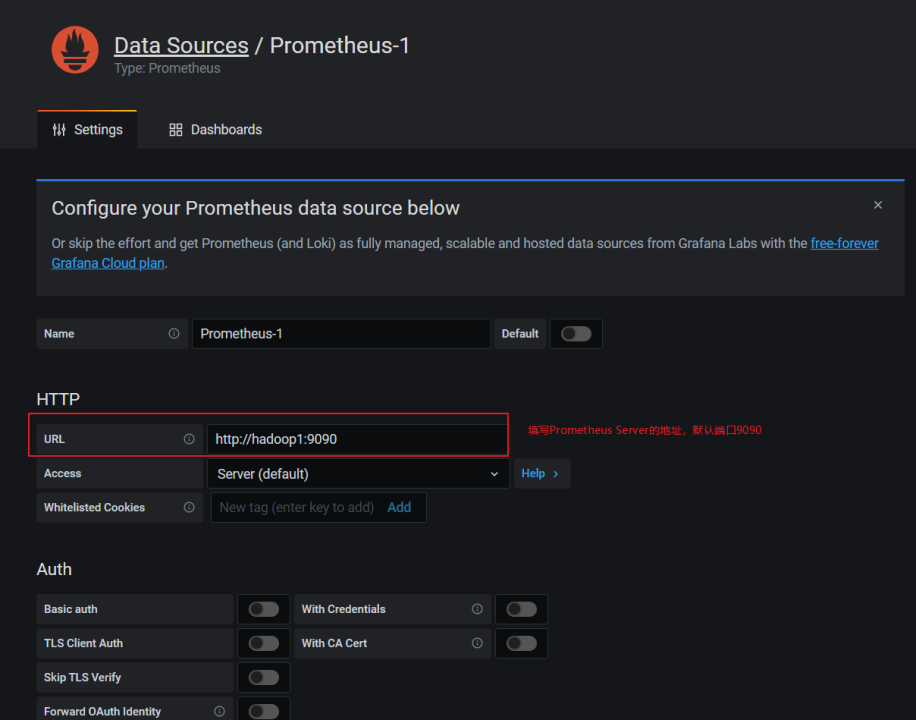
配置Prometheus Server地址:
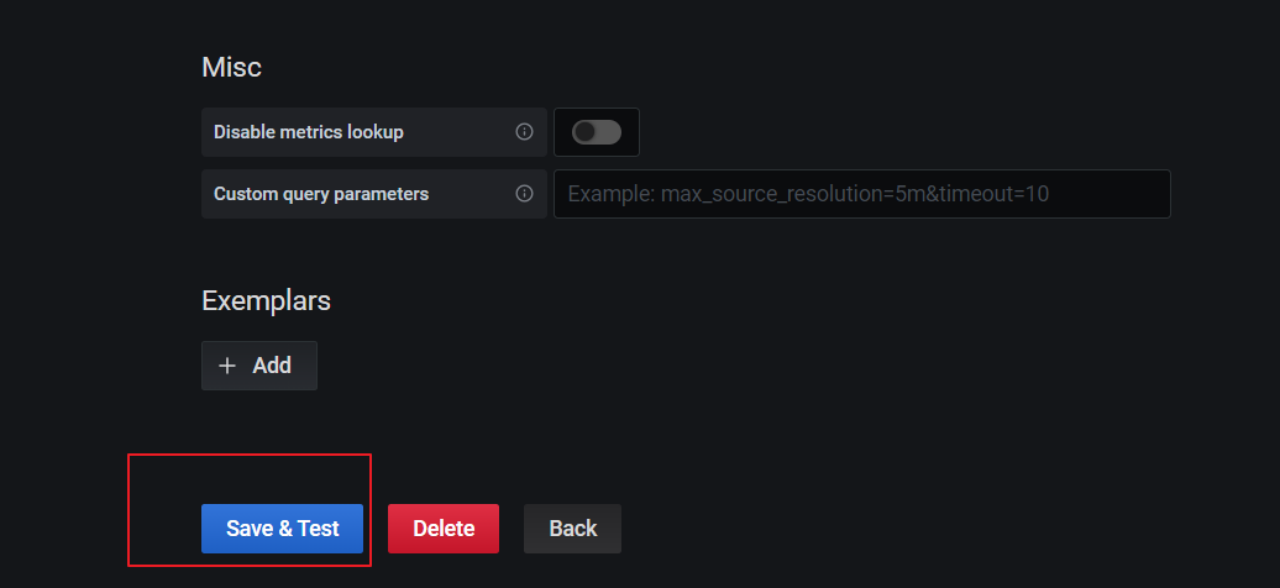
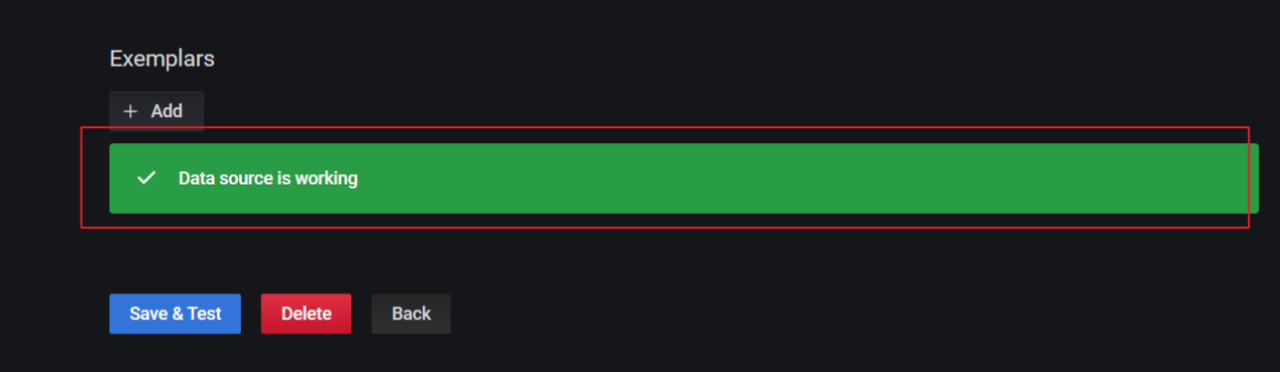
点击下方的Save&Test:
出现绿色的提示框,表示与Prometheus正常联通:
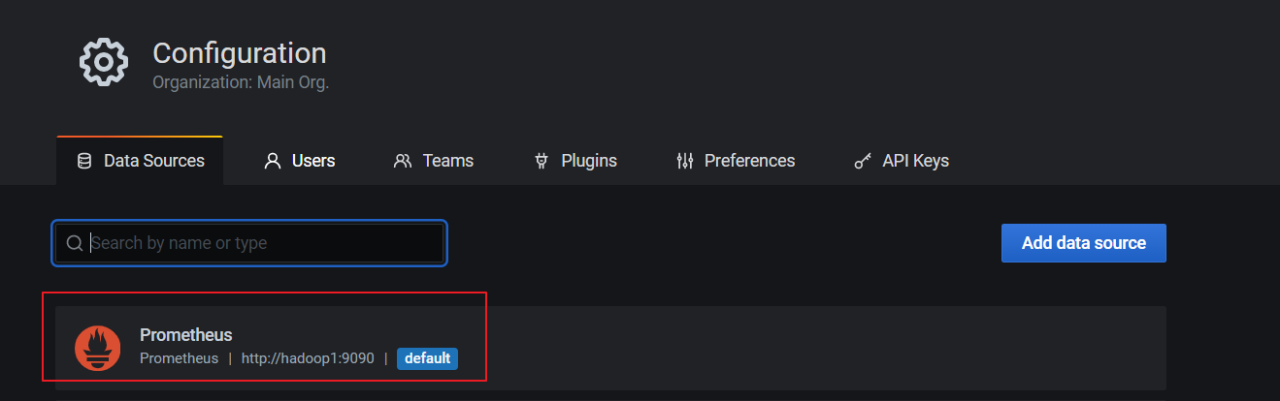
点击Back返回即可,可以看到Data Sources页面,出现了添加的Prometheus:
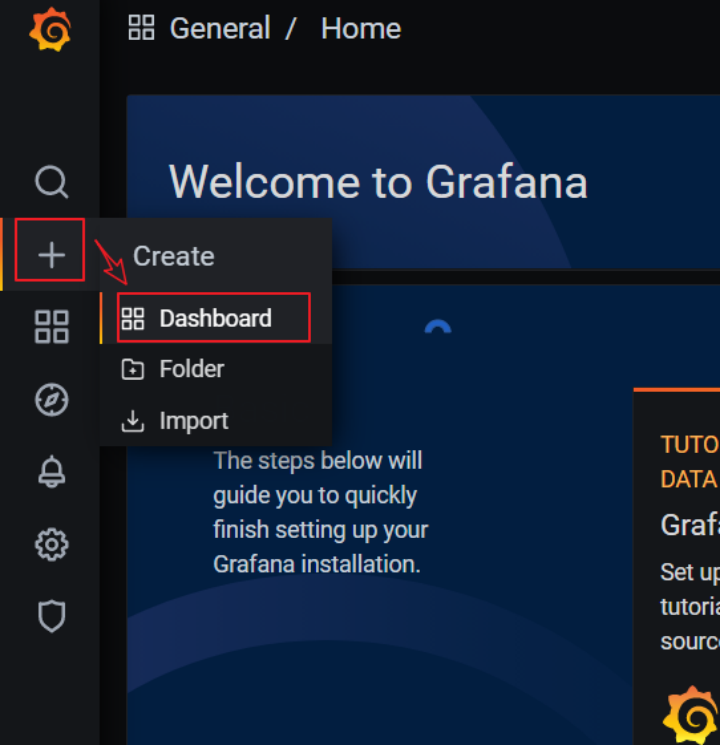
2.3手动创建仪表盘Dashboard
点击左边栏的 “+”号,选择Dashboard:
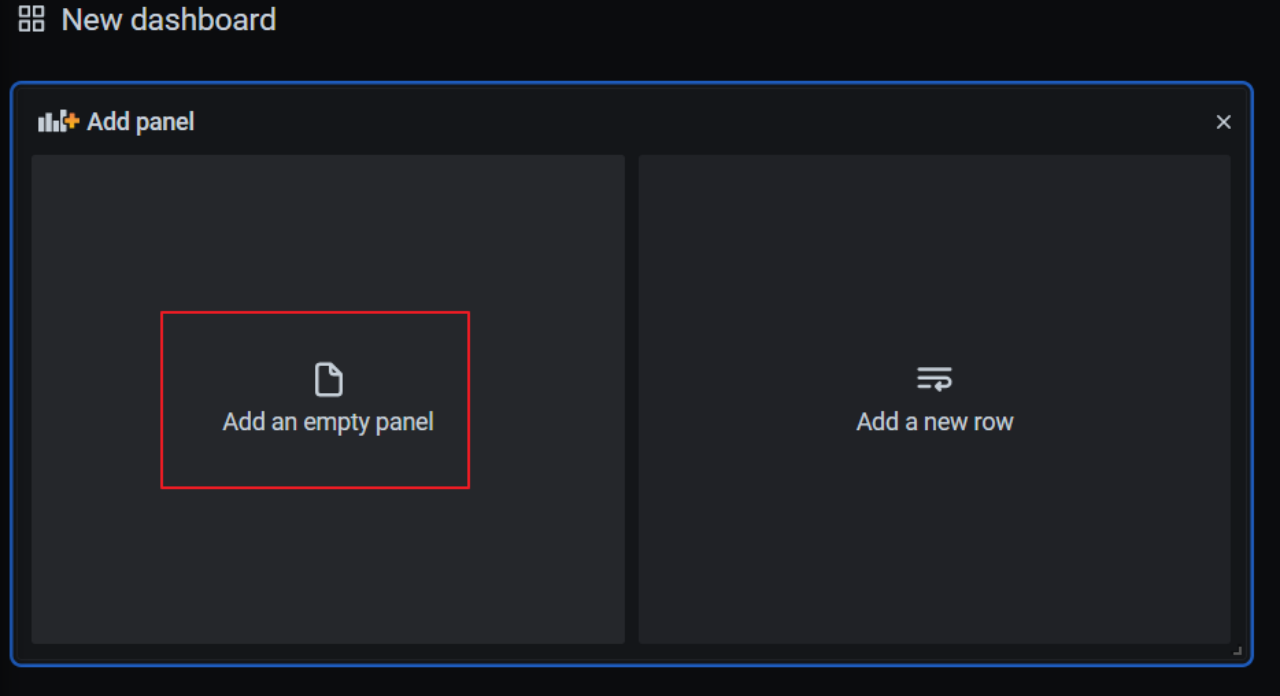
添加新的仪表板,点击Add an empty panel:
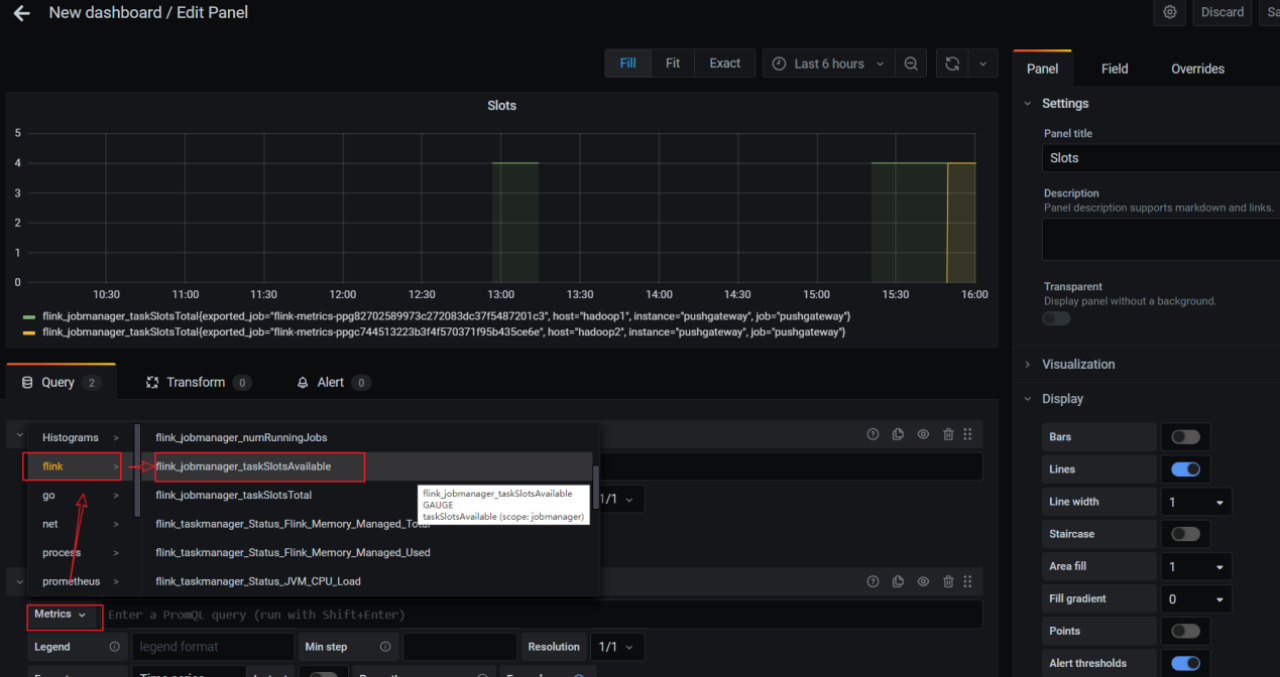
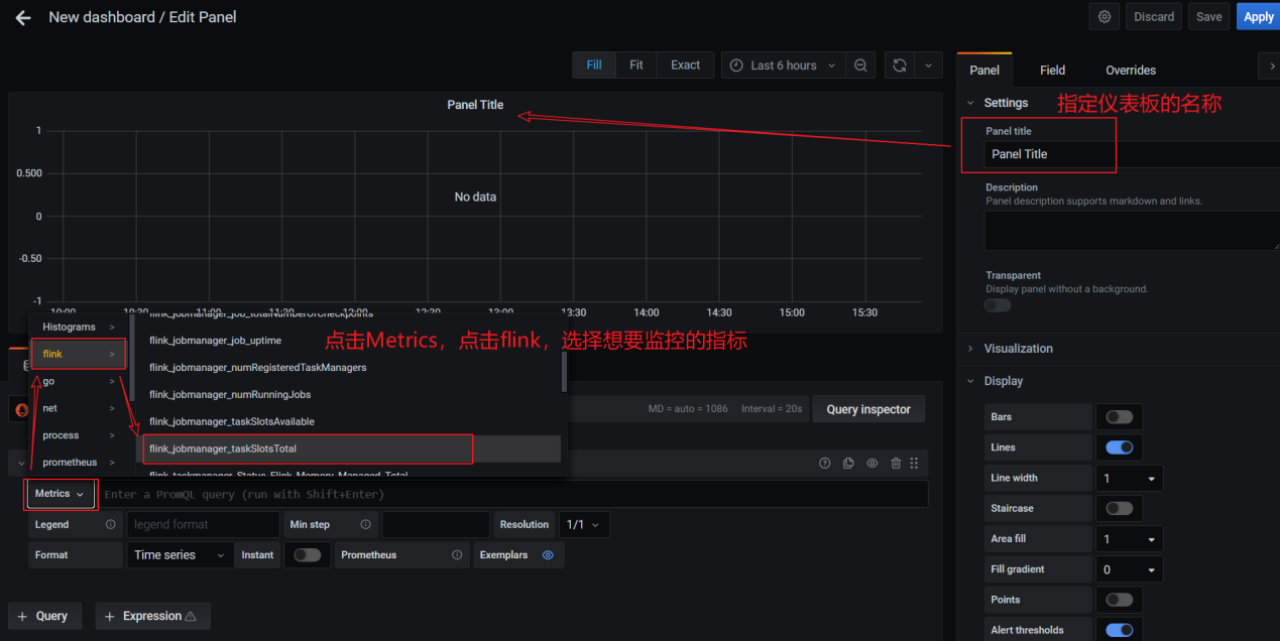
配置仪表板监控项:
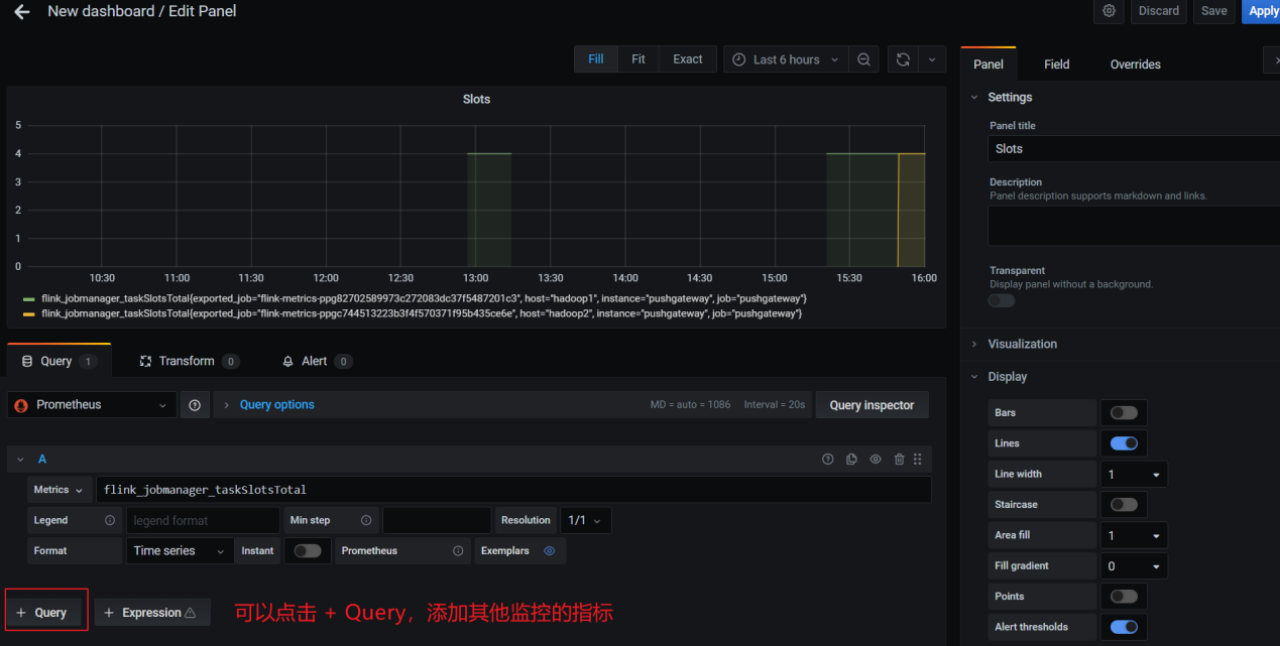
一个仪表板可以配置多个监控项,添加其他监控项:
配置新的监控项: