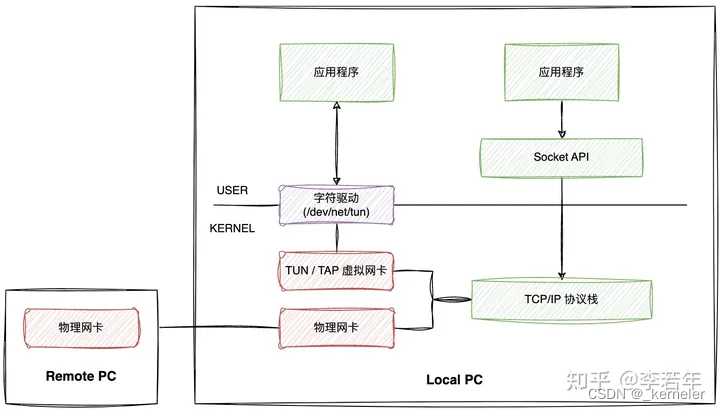
若依框架中的PieChart
如下是若依(Ruoyi)框架中的PieChart.vue文件,该PieChart.vue无法实现组件间的值传递。到这里您不妨可以试试该如何去传值。如果您不想思考,请看改进后的PieChart。直接拿走使用!
<template>
  <div :class="className" :style="{height:height,width:width}" />
</template>

<script>
import * as echarts from 'echarts'
require('echarts/theme/macarons') // echarts theme
import resize from './mixins/resize'

export default {
  mixins: [resize],
  props: {
    className: {
      type: String,
      default: 'chart'
    },
    width: {
      type: String,
      default: '100%'
    },
    height: {
      type: String,
      default: '300px'
    }
  },
  data() {
    return {
      chart: null
    }
  },
  mounted() {
    this.$nextTick(() => {
      this.initChart()
    })
  },
  beforeDestroy() {
    if (!this.chart) {
      return
    }
    this.chart.dispose()
    this.chart = null
  },
  methods: {
    initChart() {
      this.chart = echarts.init(this.$el, 'macarons')

      this.chart.setOption({
        tooltip: {
          trigger: 'item',
          formatter: '{a} <br/>{b} : {c} ({d}%)'
        },
        legend: {
          left: 'center',
          bottom: '10',
          data: ['Industries', 'Technology', 'Forex', 'Gold', 'Forecasts']
        },
        series: [
          {
            name: 'WEEKLY WRITE ARTICLES',
            type: 'pie',
            roseType: 'radius',
            radius: [15, 95],
            center: ['50%', '38%'],
            data: [
              { value: 320, name: 'Industries' },
              { value: 240, name: 'Technology' },
              { value: 149, name: 'Forex' },
              { value: 100, name: 'Gold' },
              { value: 59, name: 'Forecasts' }
            ],
            animationEasing: 'cubicInOut',
            animationDuration: 2600
          }
        ]
      })
    }
  }
}
</script>
改进后的PieChart
如下是根据若依框架改写后的PieChart.vue文件,该PieChart.vue可实现组件间的值传递。
<template>
  <div :class="className" :style="{height:height,width:width}" />
</template>

<script>
import * as echarts from 'echarts';
require('echarts/theme/macarons') // echarts theme
import resize from './mixins/resize'

export default {
  mixins: [resize],
  props: {
    className: {
      type: String,
      default: 'chart'
    },
    width: {
      type: String,
      default: '100%'
    },
    height: {
      type: String,
      default: '300px'
    },
    //添加接受饼图数据的值
    pieChartData: {
      type: Object,
      required: true
    }
  },
  data() {
    return {
      chart: null
    }
  },
  //监听饼图数据
  watch: {
    pieChartData: {
      deep: true,
      handler(val) {
        this.setOptions(val)
      }
    }
  },
  mounted() {
    this.$nextTick(() => {
      this.initChart()
    })
  },
  beforeDestroy() {
    if (!this.chart) {
      return
    }
    this.chart.dispose()
    this.chart = null
  },
  methods: {
    initChart() {
      this.chart = echarts.init(this.$el, 'macarons')
        this.setOptions(this.pieChartData)
      },
      setOptions({ x_data, ratio_data} = {}) {
        this.chart.setOption({
          tooltip: {
            trigger: 'item',
            formatter: '{a} <br/>{b} : {c} ({d}%)'
          },
          legend: {
            left: 'center',
            bottom: '10',
            // data: ['皮带跑偏', '电机停机', '设备停电', '皮带卡死', '滚轮松动'],
            data: x_data, //这里是图例的值
            textStyle: {
              color: '#fff' // 设置图标文字颜色为白色
            }
          },
          series: [
            {
              label: {
                show: true,
                color: '#fff' // 设置series文字颜色为白色
              },
              name: 'WEEKLY WRITE ARTICLES',
              type: 'pie',
              roseType: 'radius',
              radius: [15, 95],
              center: ['50%', '38%'],
              // data: [
              //   { value: 320, name: '皮带跑偏' },
              //   { value: 240, name: '电机停机' },
              //   { value: 149, name: '设备停电' },
              //   { value: 100, name: '皮带卡死' },
              //   { value: 59, name: '滚轮松动' }
              // ],
              data: ratio_data, //你要替换的值
              animationEasing: 'cubicInOut',
              animationDuration: 2600
            }
          ]
        })
      }
    }
}
</script>
其他页面使用PieChart
如下是在若依框架的首页(index.vue)中使用PieChart文件。如下图是用:pie-chart-data绑定this.pieFalutChart实现了组件间的值传递。

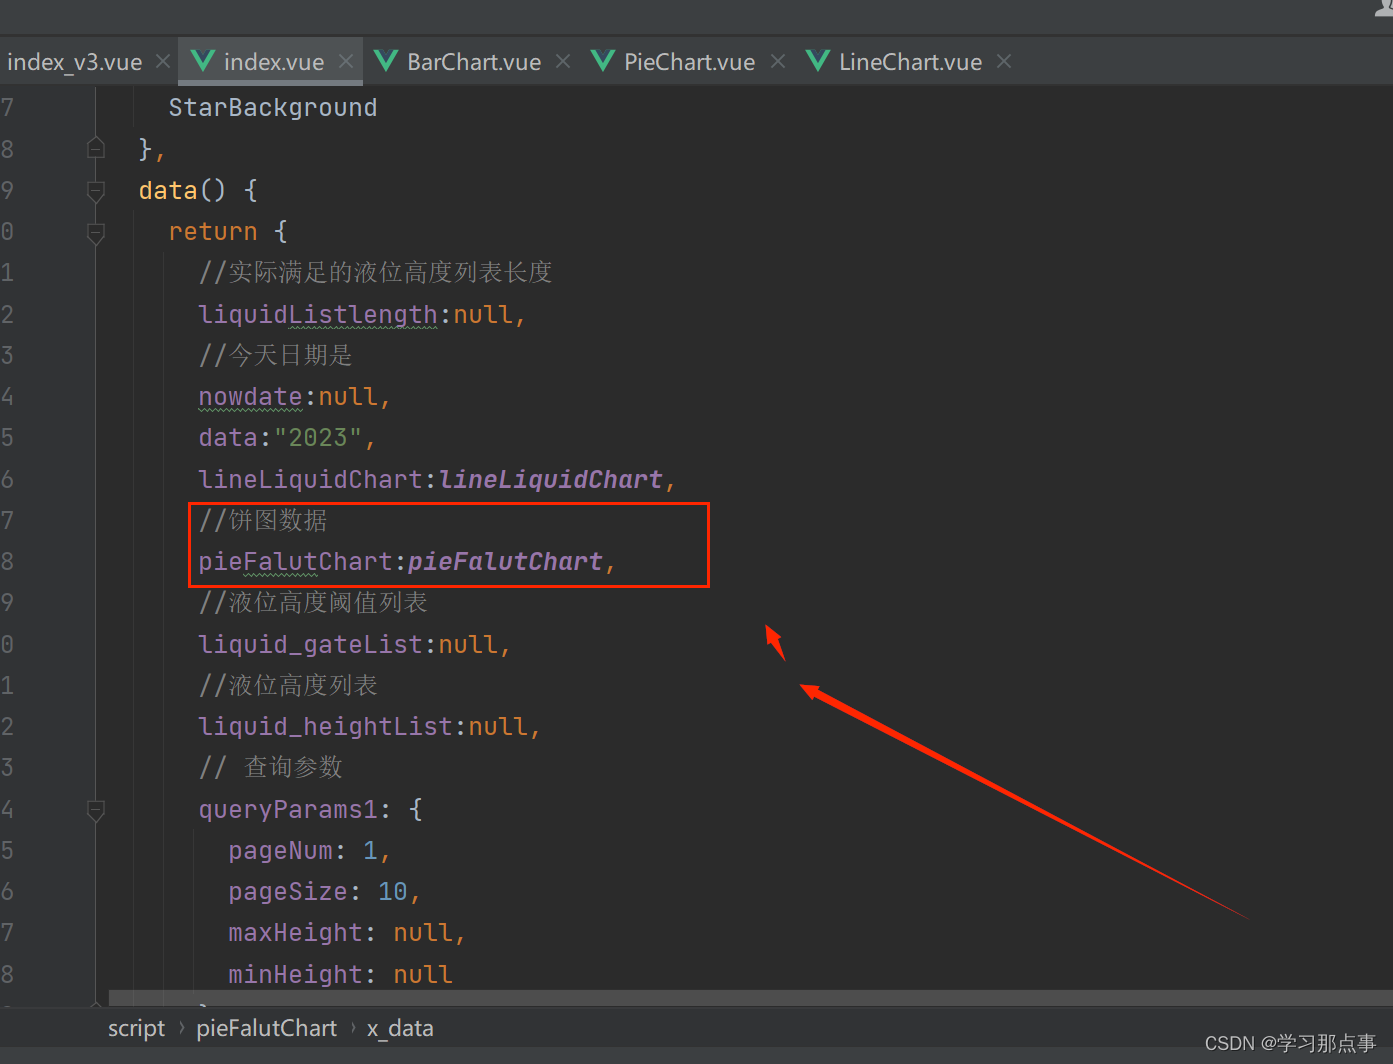
自定义数据:

data中定义饼图数据pieFalutChart:
实际效果