一、介绍
ECharts 是一个使用 JavaScript 实现的开源可视化库,涵盖各行业图表,满足各种需求。ECharts 提供了丰富的图表类型和交互能力,使用户能够通过简单的配置生成各种各样的图表,包括但不限于折线图、柱状图、散点图、饼图、雷达图、地图等。安装方式:
- CDN: https://cdn.staticfile.net/echarts/4.3.0/echarts.min.js
- NPM:npm install echarts --save
二、使用echarts展示每日网站访问量
通过查询登录日志表展示为如下样式:
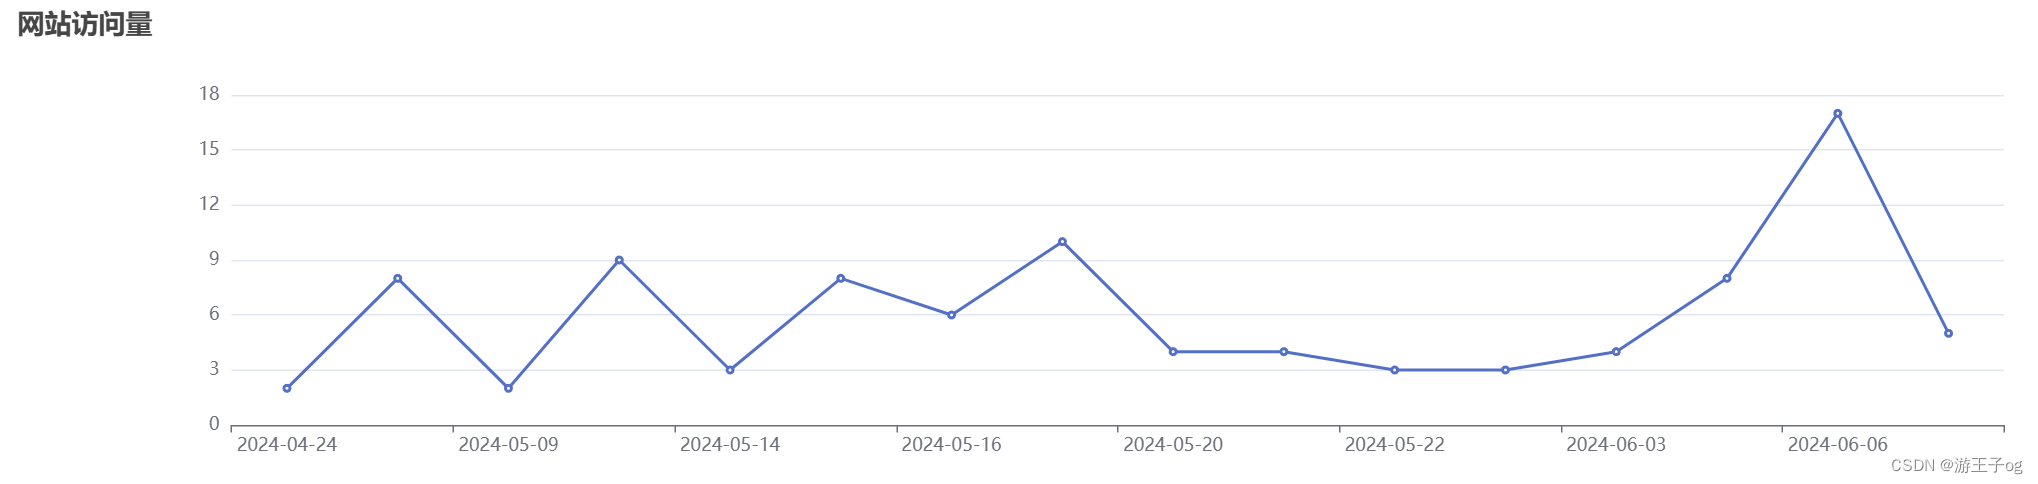
前端vue代码,一共有两个分别是每日访问量的折线图和性别人数的柱状图。访问量请求后端数据,性别则使用了假数据。
<script lang="ts" setup>
import {onMounted, ref} from "vue";
import * as echarts from "echarts";
import api from "@/axios";

const loginLogChartDiv = ref();
const genderChartDiv = ref();

onMounted(() => {
  initLoginLogECharDiv(); // 网站访问量
  initGenderChart(); // 员工性别对比图
})

function initLoginLogECharDiv() {
  const myChart = echarts.init(loginLogChartDiv.value);// 图标初始化
  let dateList = [];
  let countList = [];
  api({url: '/selLoginLogChart'}).then(resp => {
    dateList = resp.data.dateList;
    countList = resp.data.countList.map(Number);
    // 需要在后端获取数据之后绘制图表
    myChart.setOption({
      title: {
        text: '网站访问量'
      },
      tooltip: {},
      xAxis: {
        data: dateList
      },
      yAxis: {},
      series: [{
        name: '访问量',
        type: 'line',
        data: countList
      }]
    });
  });
}

function initGenderChart() {
  const myChart = echarts.init(genderChartDiv.value);// 图标初始化
// 绘制图表
  myChart.setOption({
    title: {
      text: '员工性别对比图'
    },
    tooltip: {},
    xAxis: {
      data: ['男', '女']
    },
    yAxis: {},
    series: [{
      name: '人数',
      type: 'bar',
      data: [5, 20]
    }]
  });
}

</script>

<template>
  <el-row>
    <el-col :span="24">
      <div ref="loginLogChartDiv" :style="{ float: 'left', width: '100%', height: '350px' }"></div>
    </el-col>
  </el-row>
  <el-row>
    <el-col :span="12">
      <div ref="genderChartDiv" :style="{ float: 'left', width: '100%', height: '350px' }"></div>
    </el-col>
    <el-col :span="12">
    </el-col>
  </el-row>

</template>

<style scoped>

</style>
业务层逻辑处理
@Override
    public Map<String, List<String>> selLoginLogChart(String s) {
        List<Map<String, Object>> list = logoMapper.selLoginLogChart(s);
        // 查询结果是Date类型,需要格式化
        SimpleDateFormat dateFormat = new SimpleDateFormat("yyyy-MM-dd");
        Map<String, List<String>> resultMap = new HashMap<>();
        List<String> dateList = new ArrayList<>();
        List<String> countList = new ArrayList<>();
        for (Map<String, Object> map : list) {
            dateList.add(dateFormat.format(map.get("date")));
            countList.add(map.get("count") + "");
        }
        resultMap.put("dateList", dateList);
        resultMap.put("countList", countList);
        return resultMap;
    }
sql语句,因为日期是年月日时分秒,所以需要使用DATE()提取出年月日进行分组查询。
<select id="selLoginLogChart" resultType="java.util.Map">
        select DATE(logintime) as date, count(*) as count
        from loginlog
        where logintime >= #{s}
        group by date
    </select>


![[word] word如何清除超链接 #媒体#笔记#知识分享](https://img-blog.csdnimg.cn/img_convert/eec2e03c62507d5043f72728f015a515.gif)


![[大模型]CharacterGLM-6B-chat安装与使用](https://img-blog.csdnimg.cn/direct/2833215b6fb14270a52e5430b602569c.png)
![[每周一更]-(第100期):介绍 goctl自动生成代码](https://img-blog.csdnimg.cn/direct/a12ecf2f35644037adb8209605eccf85.jpeg#pic_center)
![51 单片机[6]:矩阵键盘及密码锁](https://img-blog.csdnimg.cn/img_convert/d9813fc28ff6d650845d062e8117981b.png)