Enhance Analytics with Angular Chart Trend Lines
December 1, 2023
Provide a visual representation of the overall direction of chart data, helping users identify trends and patterns.
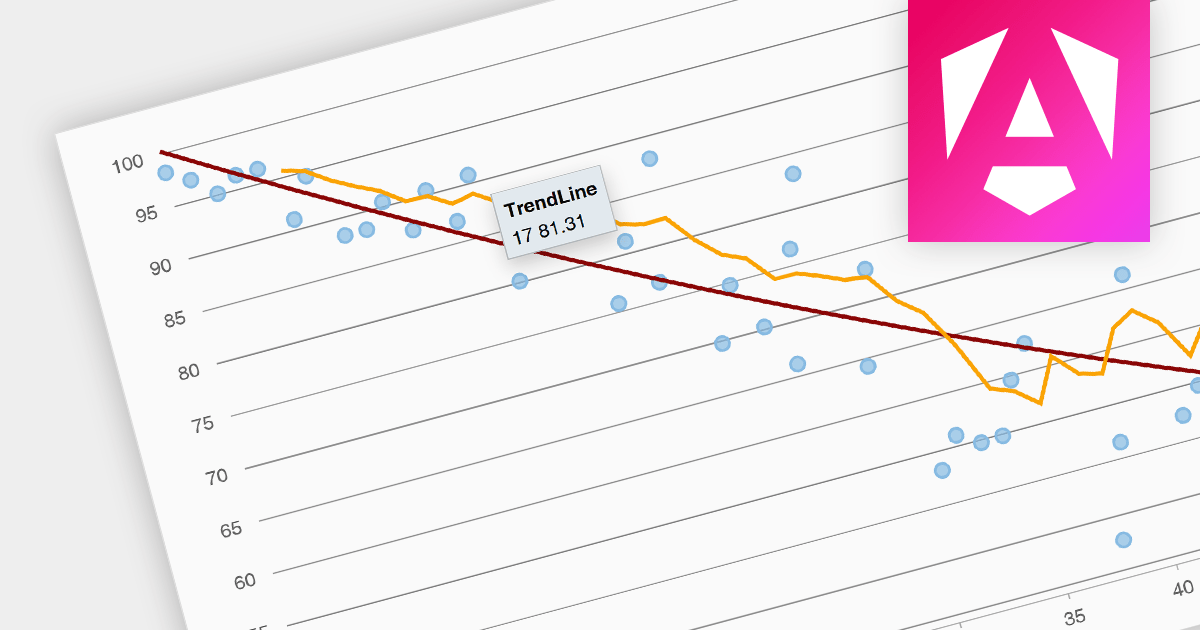
Trend lines are a chart feature used to indicate patterns or trends in data over time. Common examples include linear, exponential, polynomial, logarithmic, and moving average. Trend lines are crucial for making predictions or understanding the direction of data points in scatter plots and line charts, helping make data-driven decisions.
Several Angular chart components provide trend line support including:
- Highcharts Stock by Highsoft features various trend line types and customization options.
- Wijmo FlexChart and FinancialChart (part of Wijmo by MESCIUS) includes trend lines for analyzing and visualizing data trends.
- amCharts 5: Stock Chart offers a variety of trend line types and advanced analytical features.
- AnyStock JS by AnyChart provides rich trend line customization and predictive analysis capabilities.
- JSCharting supports trend lines with a variety of line fit variations.
For an in-depth analysis of features and price, visit our Angular Chart Component comparison.
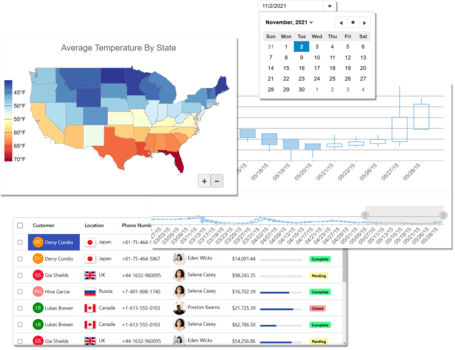
Wijmo is a complete collection of extensible, fast JavaScript UI components written in TypeScript. The framework-agnostic Wijmo components include first-class support for top frameworks including Angular, React, Vue and Web Components. Wijmo Enterprise has over 100 dynamic JavaScript UI components to help cut your development time in half. Build lightweight, high-performance JavaScript applications using your favorite JavaScript framework. Wijmo is built to be small, extensible, and fast. The easy-to-read, flexible API has a low learning curve and allows you to analyze data with OLAP, PivotGrid and PivotChart. Visualize data with 80+ chart types, including FlexChart which provides virtualized renderings, limitless cell templates, dozens of chart elements, interactions, and customizations.


Fast and Lightweight JavaScript Components
Wijmo components will never bloat your web apps. Built for top performance, the components aren't just dependency-free, they are also built to be small, extensible, and fast.
Flexible, Extensible API
The easy-to-read, flexible Wijmo API has a low learning curve, and components have a simple core with as many extensibility points as possible.
First-Class Framework Support
Built to be framework-agnostic, Wijmo includes full support for Angular, React, Vue...